Bit that had risen slightly during the Christmas period has recently shown a downward trend. Market participants are putting downward pressure on the prices of major cryptocurrencies as they realize their profits.
As buying activity weakens, the price of Bit could soon fall below the important $90,000 level. This analysis explores some of the reasons for this forecast.
Bit bears strengthen price pressure
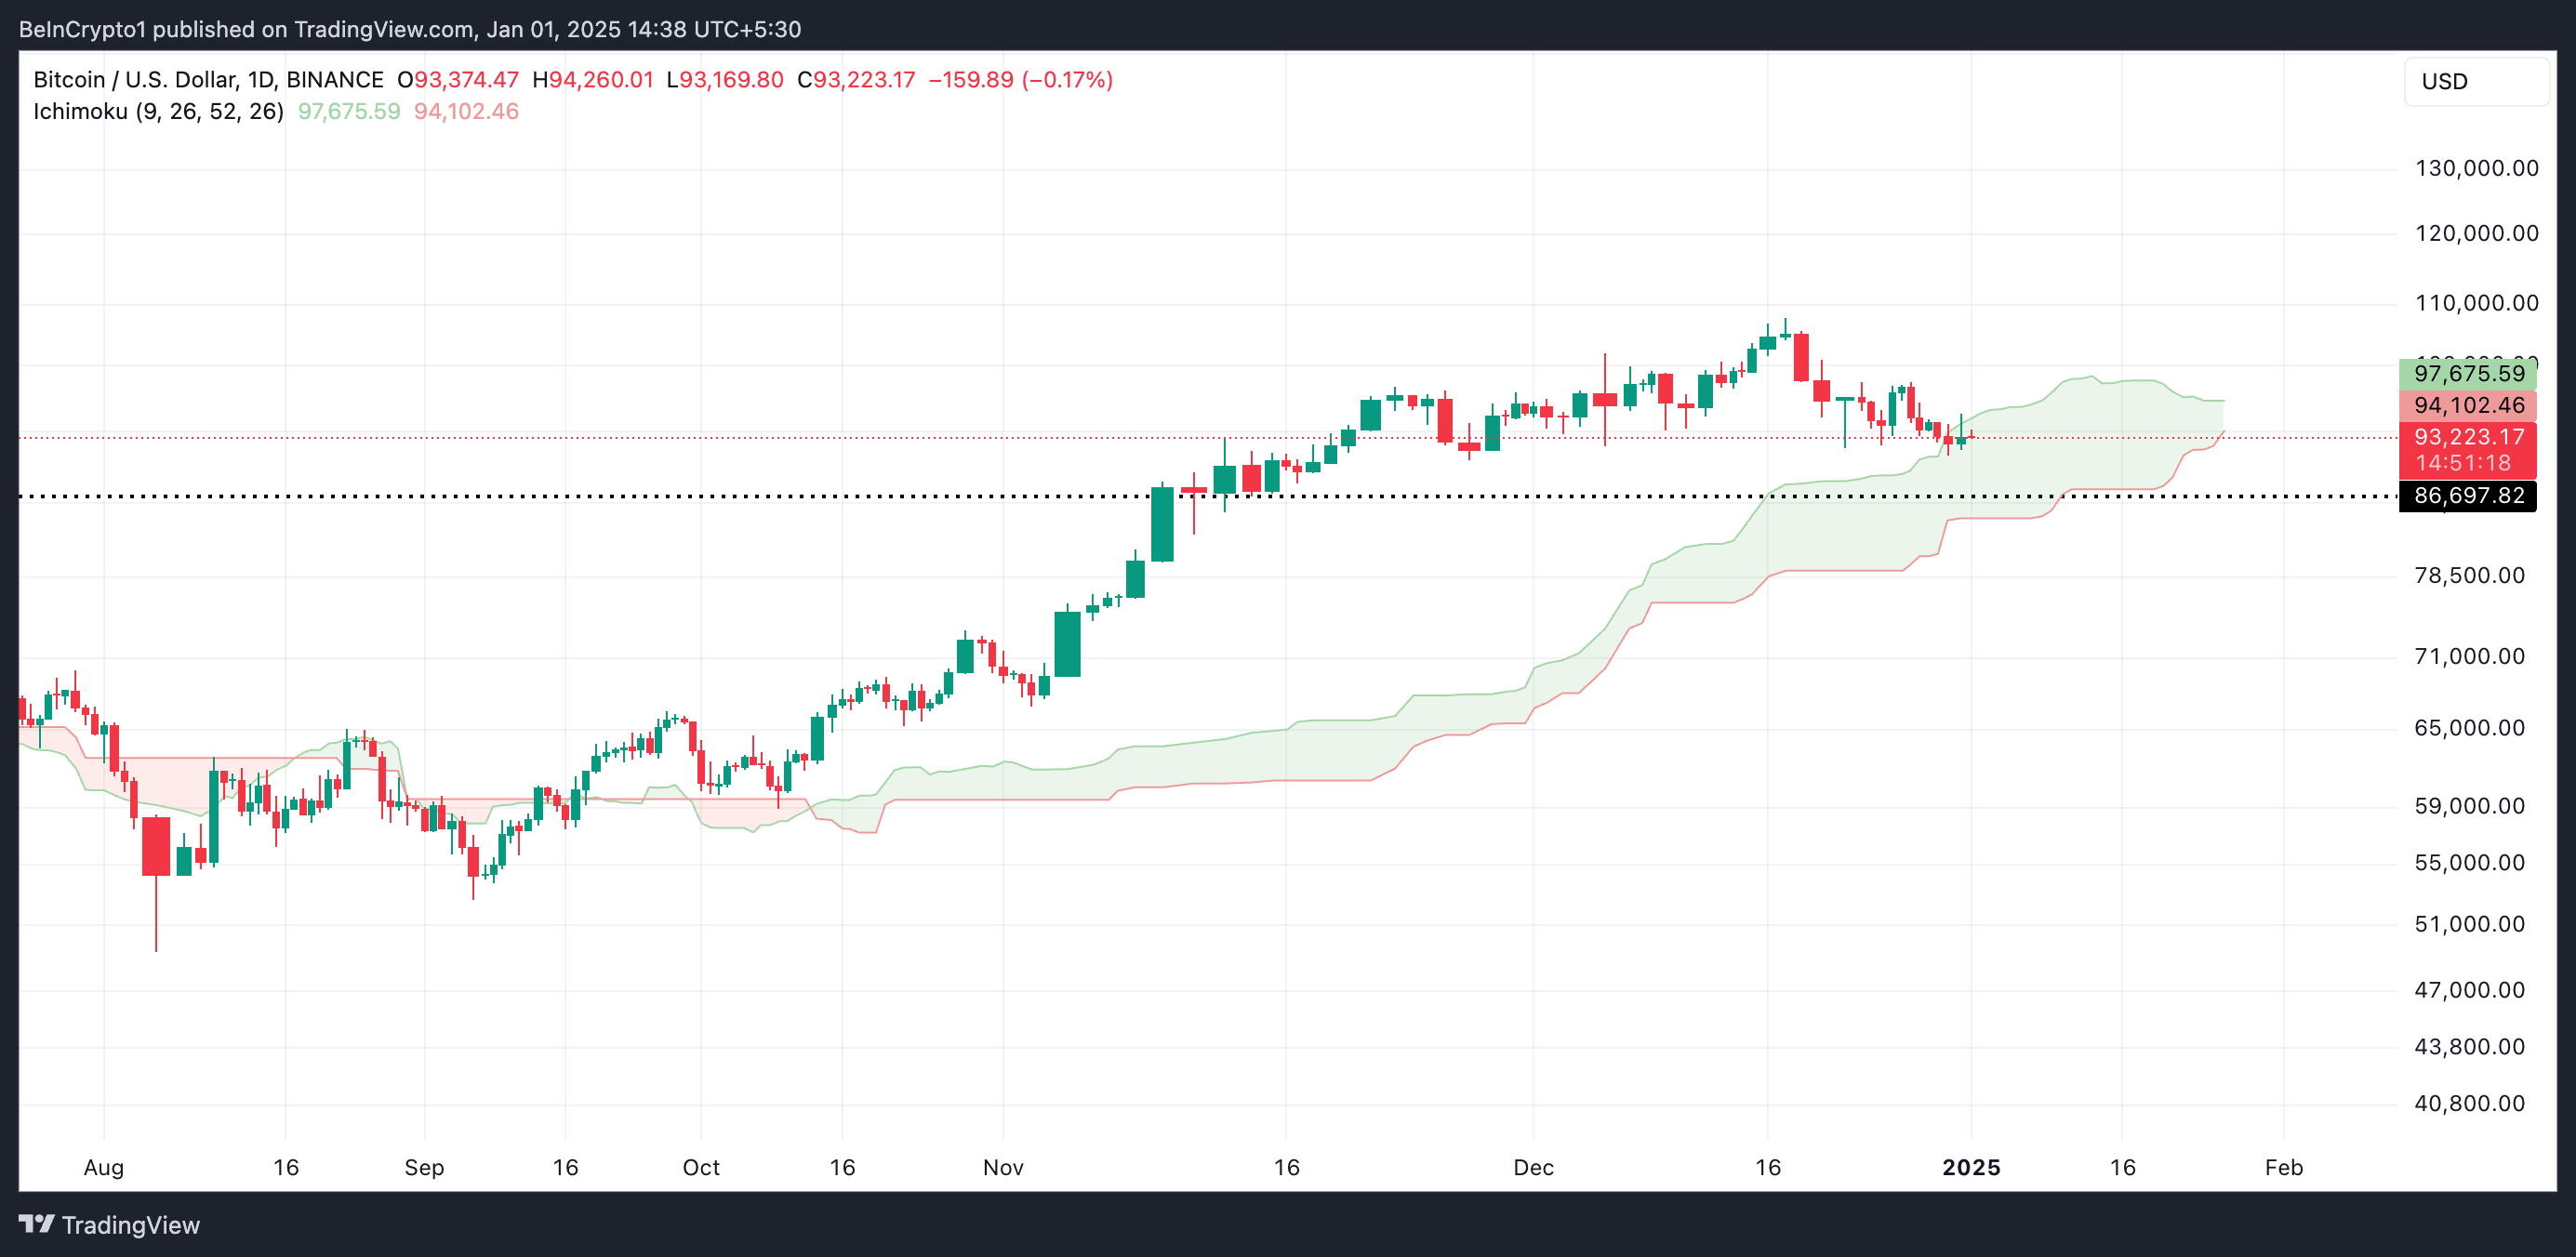
The recent decline in Bit over the past few days has pushed the price below the leading Span A (green line) of the Ichimoku Cloud indicator. This indicator tracks the market momentum of an asset and identifies potential support/resistance levels.
When an asset's price falls below the leading Span A of the Ichimoku Cloud, it indicates a weakening of momentum and a potential bearish reversal. Since the leading Span A represents a short-term support level, falling below it suggests that the asset's uptrend is weakening.

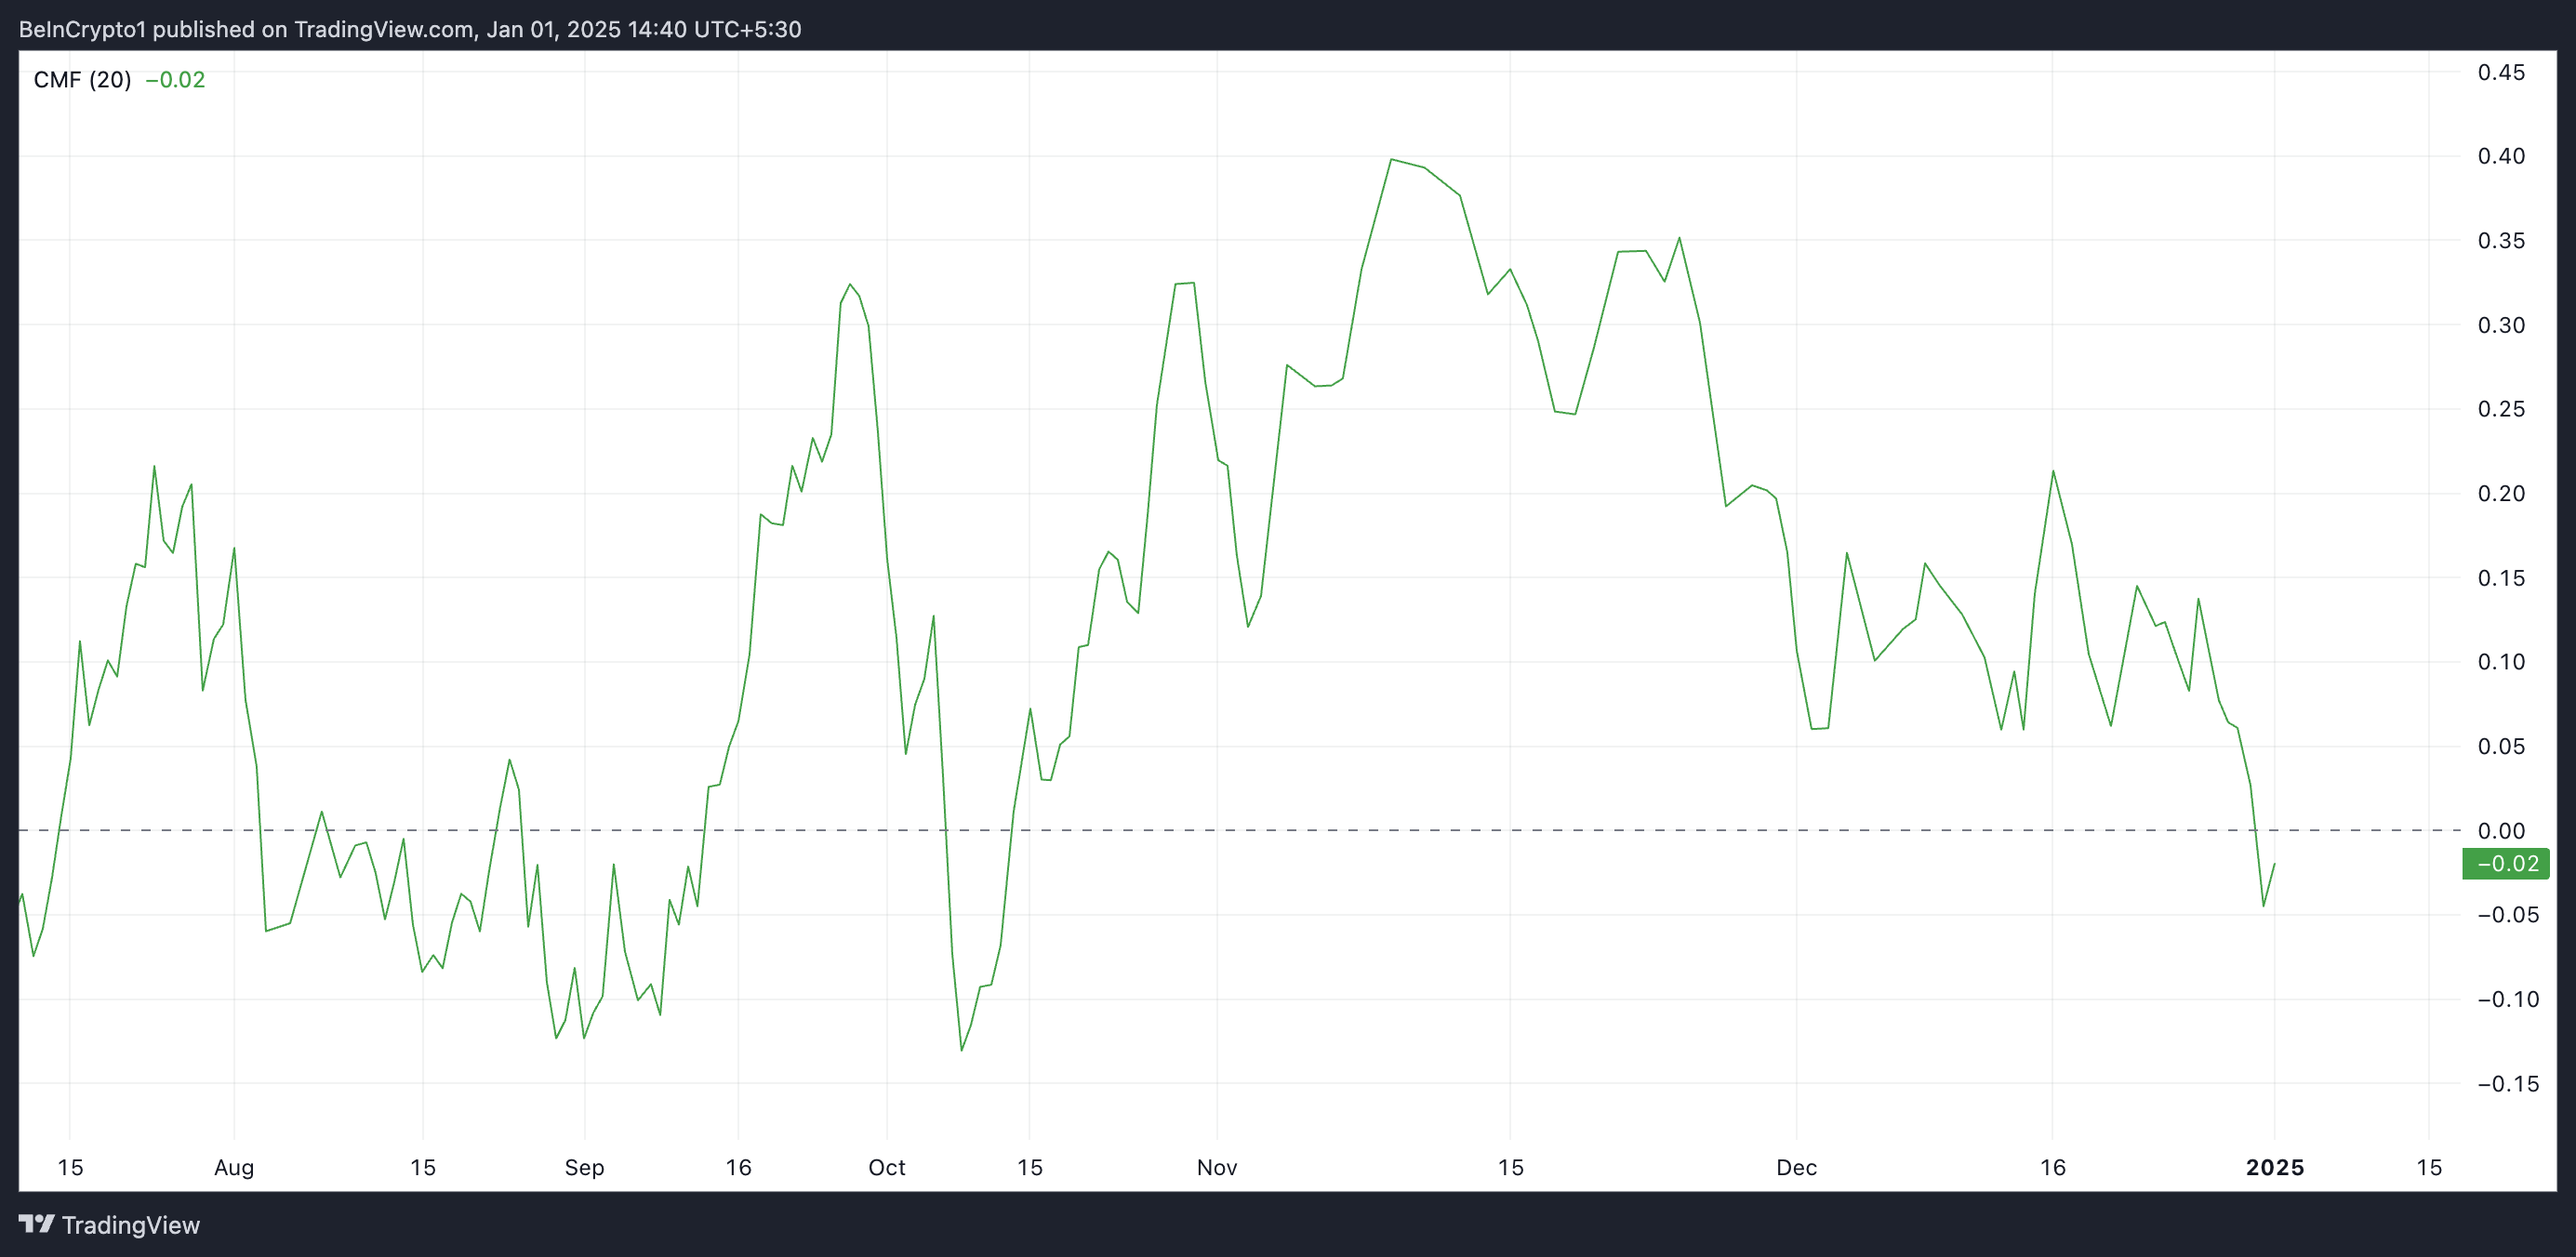
Additionally, the negative Chaikin Money Flow (CMF) of the coin confirms the decrease in demand for Bit. At the time of writing, this indicator is at -0.02, below the 0 line.
Based on price and volume, the CMF indicator measures the strength of the money flow into an asset over a specific period. In the case of Bit, a value below 0 indicates that selling pressure is dominant, suggesting that outflows are greater than inflows. This is a bearish signal that implies weakening demand and potential downward price momentum.

Bit price forecast: Is the next support level $91,000?
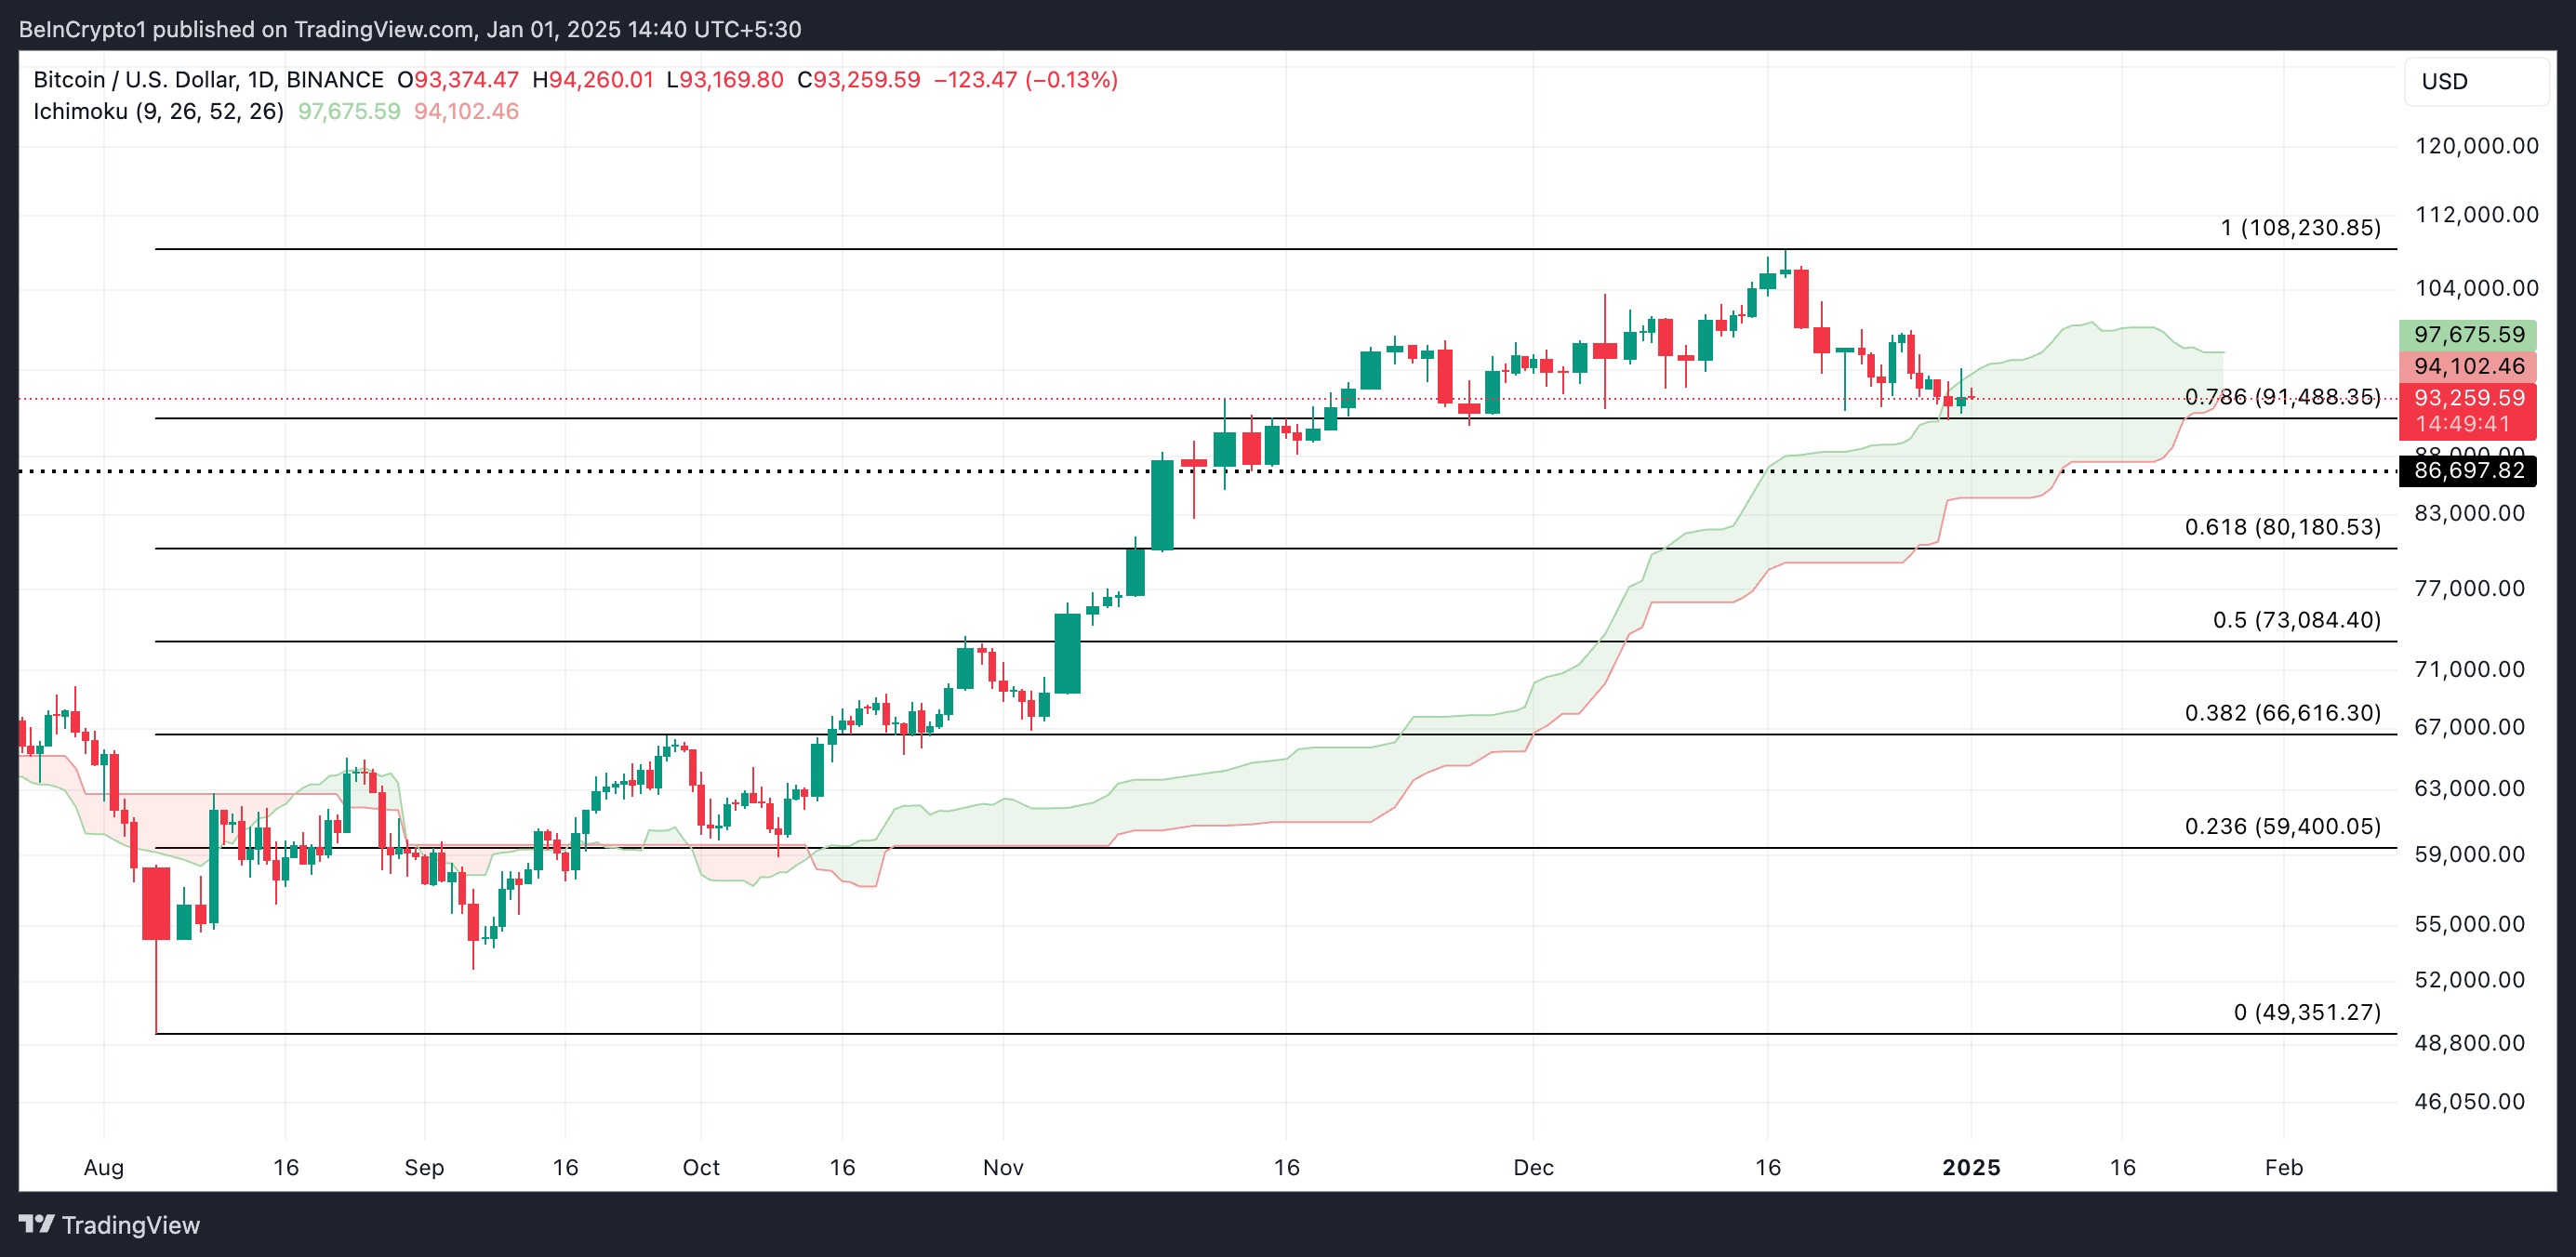
The next major support level for Bit at $91,488 may not hold if demand weakens further. In that case, the price of the coin could fall below $90,000 for the first time since early November, dropping as low as $86,697.

However, if Bit experiences a revival of buying activity, this could push the price above the dynamic resistance of $97,675 provided by the leading Span A of the Ichimoku Cloud. Successfully breaking through this level could see Bit revisit its all-time high of $108,230.


