

BNB has attracted attention in recent weeks, with increased trading volume and growing interest in its ecosystem, including meme coins like TST. Despite the excitement, the price of BNB has dropped more than 3% in the past seven days, reflecting the continued market uncertainty.
Its DMI shows weak trend strength and increasing selling pressure, while the Ichimoku Cloud indicates a bearish setup. With the EMA lines not showing a clear direction, BNB is facing an important moment where it could regain momentum or drop below $600 if the downtrend continues.
BNB's DMI shows buyers have tried to take control, but sellers are pushing back
BNB's DMI chart shows its ADX at 14, reflecting weak trend strength after touching a low of 11.1 yesterday and rising to near 16 a few hours ago.
ADX, or Average Directional Index, measures the strength of a trend without indicating its direction. It ranges from 0 to 100, with values above 25 indicating a strong trend and values below 20 showing a weak or undefined trend.
With an ADX of 14, BNB is currently in a low-momentum phase, indicating a lack of a clear trend in the market.
 BNB DMI. Source: TradingView.
+DI is at 22.5, up from 15.2 yesterday but down from 30.3 a few hours ago, suggesting buying pressure has increased but then weakened. Meanwhile, -DI is at 23.5, up from 14.2 a day earlier, indicating increasing selling pressure.
The proximity of +DI and -DI shows a tug-of-war between buyers and sellers, reflecting the market's hesitation. With low ADX and +DI and -DI close together, the BNB price is likely to remain range-bound until a stronger trend emerges.
If +DI crosses above -DI, it could signal a bullish reversal, while -DI maintaining dominance could lead to further price declines.
Ichimoku Cloud shows a bearish setup
The Ichimoku Cloud for BNB suggests a bearish outlook. The price is currently trading below the cloud, indicating a downward momentum. The red cloud ahead presents resistance, making it difficult for BNB to break above current levels.
The Tenkan-sen line (green line) is below the Kijun-sen line (orange line), confirming a bearish crossover, which often signals continued selling pressure.
 BNB Ichimoku Cloud. Source: TradingView.
Additionally, the Chikou Span (green line) is below the price action, supporting the bearish sentiment. If this downtrend continues, BNB may test lower support levels.
However, a breakout above the red cloud would be necessary to shift to a bullish outlook. Currently, the bearish structure remains intact, indicating continued downside risk.
BNB may drop below $600
BNB's EMA lines are currently very close together, indicating a lack of clear direction in the trend. This consolidation reflects the market's indecision, as neither the bulls nor the bears have a clear advantage.
Nevertheless, BNB has recently attracted attention, with its trading volume surpassing Solana and meme coins like TST gaining traction within the BNB ecosystem.
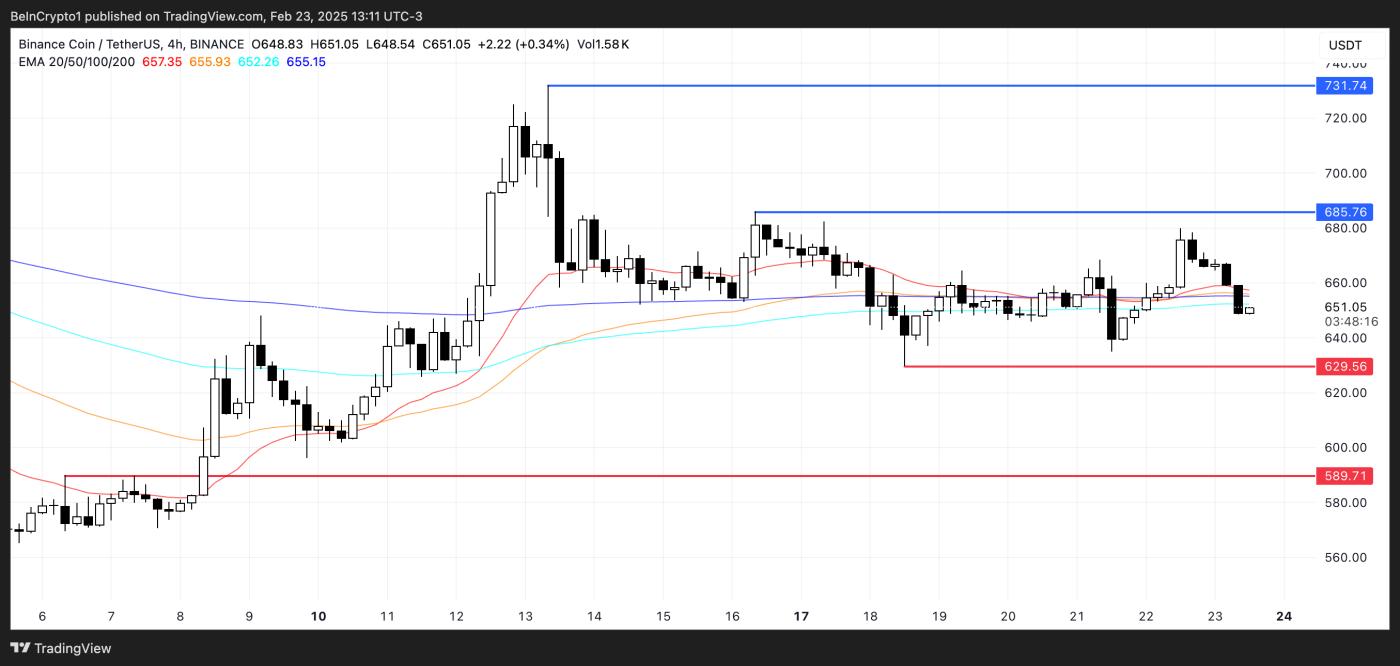 BNB Price Analysis. Source: TradingView.
If it can regain positive momentum, it may test the resistance level at $685, and a break above this could push the price up to $731.
However, if a downtrend emerges, the BNB price may test the support level at $629. A break below this could lead to a decline to $589, marking the first time it has dropped below $600 since February 8th.


