Meteora is a DeFi project on the Solana chain, focusing on building an efficient, sustainable and flexible liquidity layer for the Solana ecosystem. Its goal is to solve the problem of insufficient liquidity on Solana, making transactions smoother and cheaper, while also providing better returns for users who provide liquidity.
Meteora's pools are mainly DLMM pools and Dynamic Pools, and in the DLMM pools, users can add dual-sided pools and single-sided pools. Among them, the dev can use the single-sided pool for selling and accumulating tokens, such as the trump/sol trading pair. When the price rises, the dev can only add the single-sided pool of $trump in a higher price range, and when the price rises to this price range, it will automatically exchange $trump for $sol to sell. At the same time, they can also obtain the transaction fee; when the price falls, the dev can only add the single-sided pool of $sol in a lower price range, and when the price falls to the corresponding price range, it will automatically buy $trump, achieving the purpose of accumulating tokens.
If we want to know at what price the dev uses the single-sided pool to sell and accumulate tokens, it is necessary to know the corresponding price range.
I. Basic Concepts
Website: https://app.meteora.ag/
1. Trading Pair
Any two tokens form a trading pair, such as $trump and $sol forming the trump-sol trading pair, and $trump and $usdc forming the trump-usdc trading pair.
2. Pool (LP Pool)
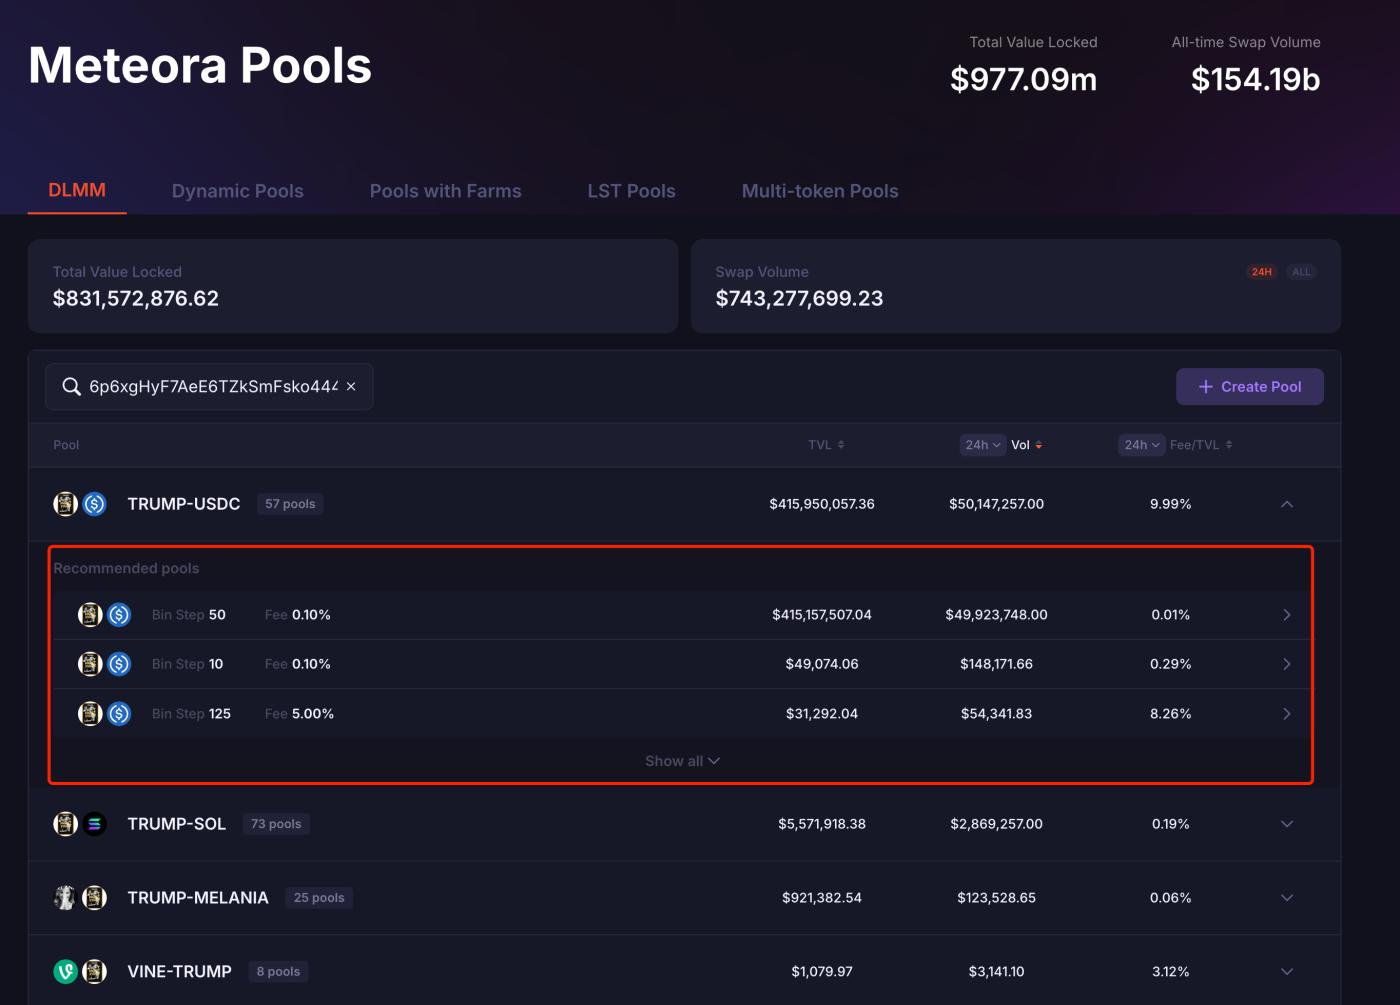
There can be multiple Pools under each trading pair, each Pool is distinguished by different Bin Step and Fee (transaction fee). For example, under the trump-usdc trading pair, there are 57 Pools, and each Pool corresponds to a unique address, as shown in the figure.
3. Bin
In DLMM, each bin represents a price, and each bin is the buy or sell order at a certain price.
4. Bin Step
Bin step refers to the price interval between two adjacent bins, measured in basis points (1 basis point = 0.01%). It determines the density of the bins and the granularity of the liquidity distribution, and is set by the pool creator.
For example:
Assuming the current SOL/USDC price is $20, and the bin step is set to 25 basis points (0.25%).
The price of the next bin will be 20 × 1.0025 = $20.05, and the next one will be 20.05 × 1.0025 ≈ $20.10, and so on.
5. Position
A position is used to describe how a liquidity provider allocates their funds to a specific price range, and each position corresponds to a unique address. A position is created within a specific pool, and a pool can create multiple different positions.
A position typically includes the following key elements:
(1) Price Range
Each position has a clear price range, indicating the price range that the liquidity provider wants to support, which is composed of a set of consecutive bins.
(2) Fund Amount
The amount of the two tokens (such as SOL and USDC) invested. Meteora will calculate the specific proportion of each token based on the current price and the range, to ensure that the pool's needs are met.
(3) Distribution Strategy
Meteora provides several liquidity distribution methods, allowing users to decide how to allocate funds to each bin:
Spot (uniform distribution): Funds are evenly distributed to each bin, suitable for scenarios with expected small price fluctuations.
Curve (bell-shaped distribution): Funds are concentrated around the current price, with less the further away from the current price, like a bell curve, suitable for LPs who want to focus on the current price.
Bid-Ask (bi-modal distribution): Funds are concentrated on both sides of the current price, forming two peaks, suitable for high volatility markets.
(4) Bin Step
Users cannot change the bin step when creating a position, as it is set when creating the pool.
II. Connect Wallet to View
Meteora supports viewing held positions after connecting a wallet address, and also supports viewing in observation mode, which we can use to view the price ranges of the pool.
Take $trump (6p6xgHyF7AeE6TZkSmFsko444wqoP15icUSqi2jfGiPN) as an example.
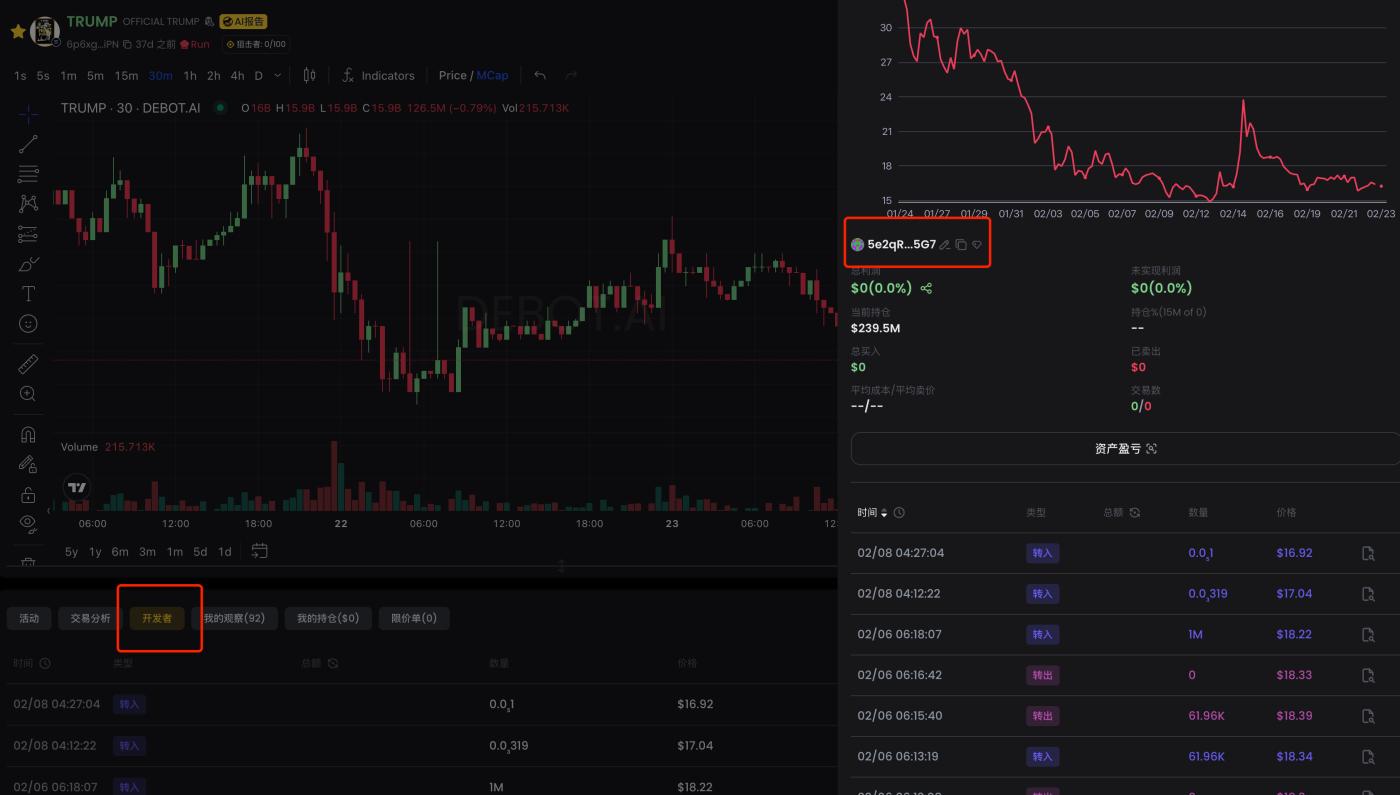
First, we open debot, enter the CA of $trump, and find the dev's address 5e2qRc1DNEXmyxP8qwPwJhRWjef7usLyi7v5xjqLr5G7, as shown in the figure.
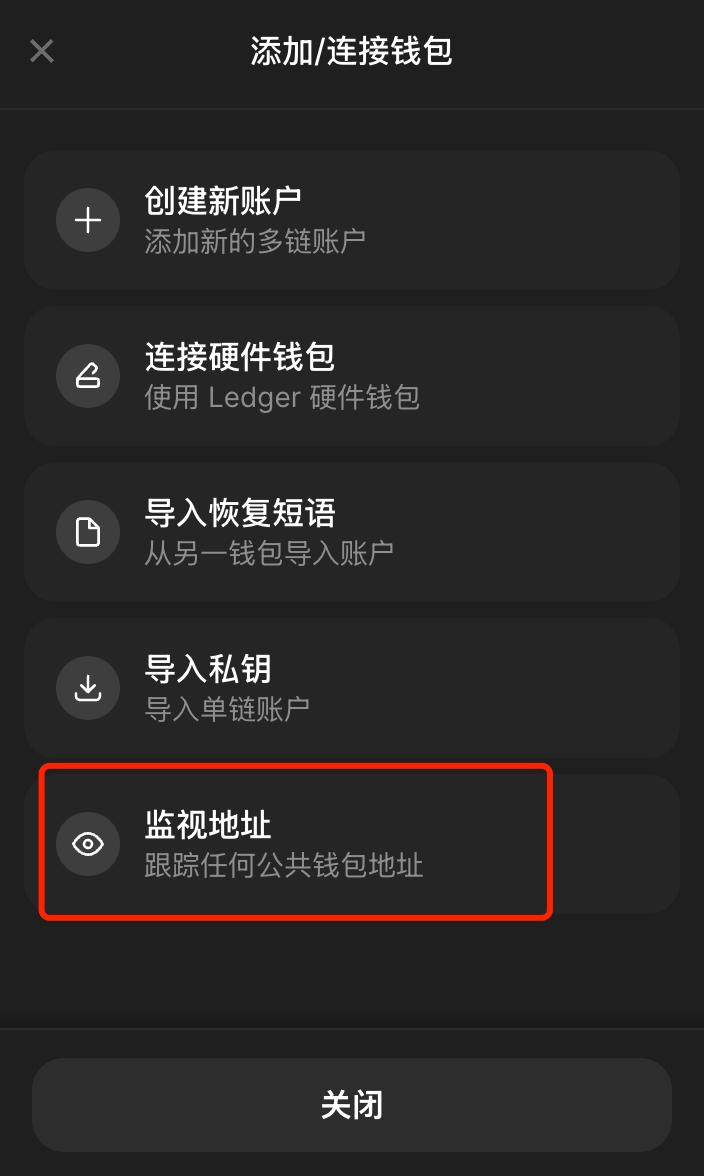
Then, open the Phantom wallet, [Add/Connect Wallet] -- [Watch Address], enter the "Name" and "Address", and fill in the dev's address 5e2qRc1DNEXmyxP8qwPwJhRWjef7usLyi7v5xjqLr5G7 here.
Finally, open Meteora, connect the Phantom wallet, and click [Portfolio] at the top to see all the added pools. Click on any DLMM pool, and it will show the details of the pool and all the positions, as shown in the figure.
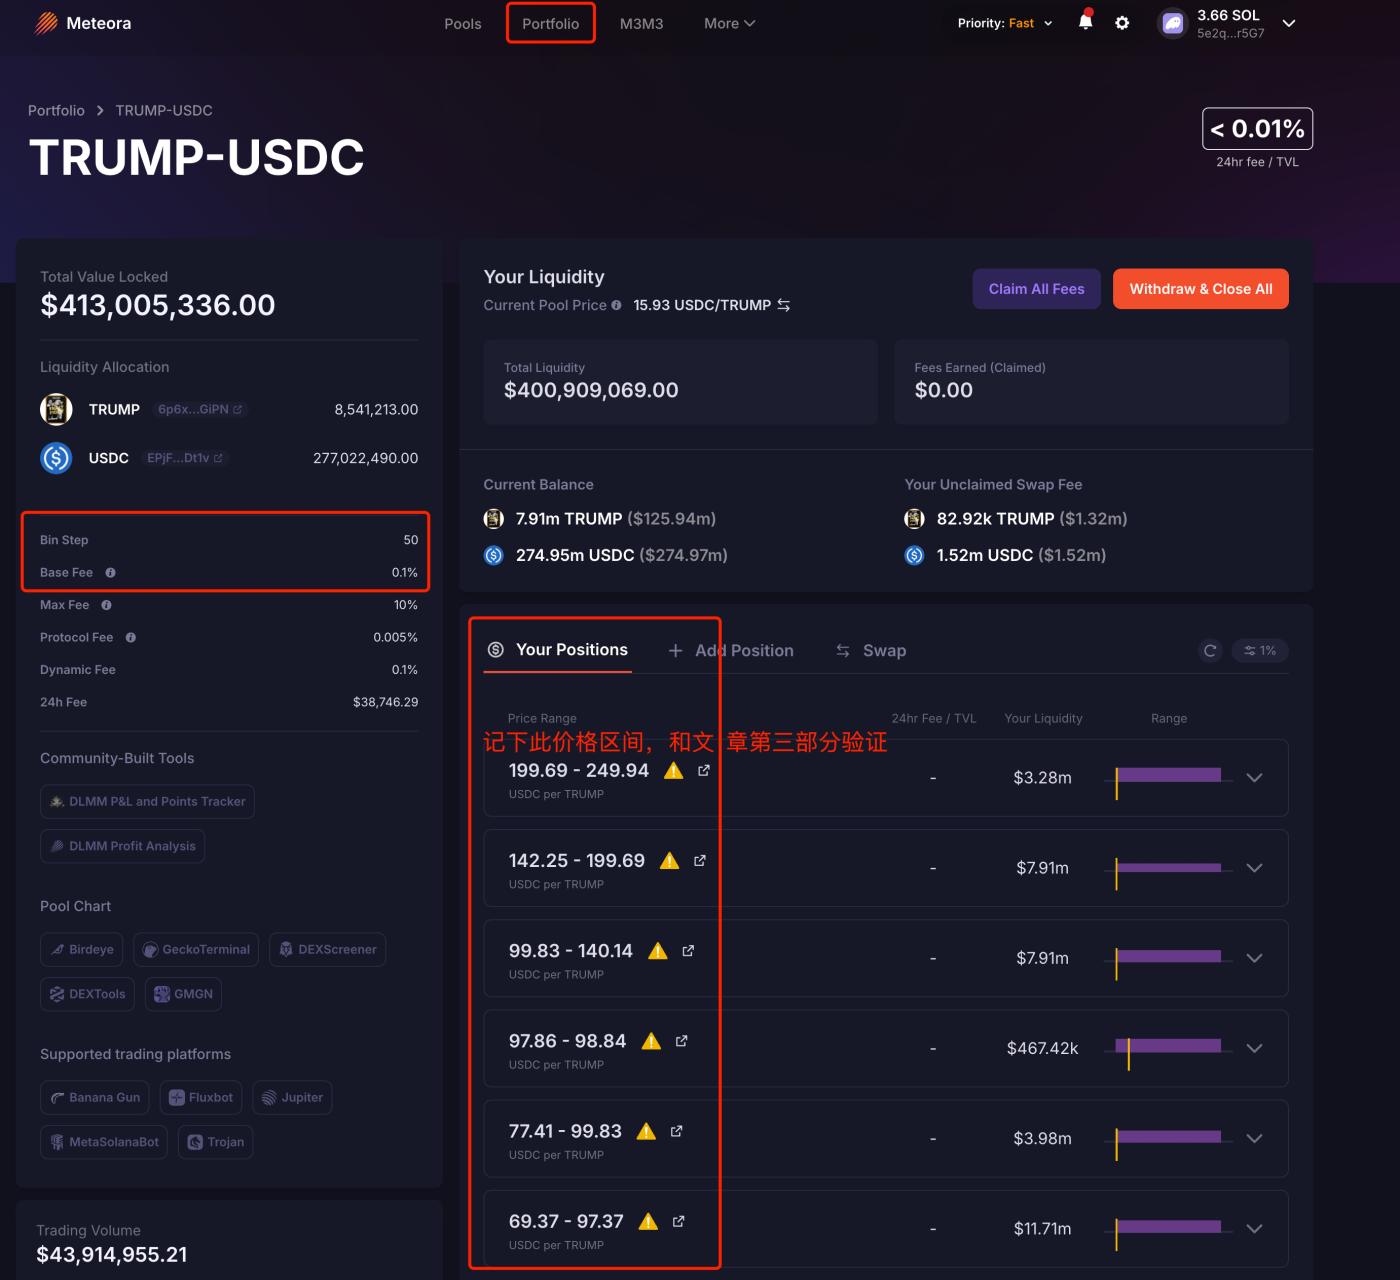
The Bin Step and Base Fee on the left side are the information of the current pool, and the middle part shows the positions of different price ranges. Clicking on any position can see the current balance, unclaimed transaction fees, distribution strategy, and other information.
The advantage of this method of viewing the price range is that it is convenient and intuitive, and can list all the existing position data; the disadvantage is that it cannot be viewed when the liquidity is withdrawn.
III. On-chain Data Calculation
We can use on-chain data to calculate the price range of each position, regardless of whether the position still exists.
Meteora's documentation provides the calculation formula:
Minimum price of the price range: min_price = (1 + bin_step/10000)^lower_bin_id
Maximum price of the price range: max_price = (1 + bin_step/10000)^upper_bin_id
If the trading pair is represented as A/B, where the decimal of token A is decimals_A and the decimal of token B is decimals_B, then the final calculation formula is:
Minimum price of the price range: min_price = (1 + bin_step/10000)^lower_bin_id/10^(decimals_B-decimals_A)
Maximum price of the price range: max_price = (1 + bin_step/10000)^upper_bin_id/10^(decimals_B-decimals_A)
Note that the calculated price is the price of token A relative to token B. If you want to view the price of token A relative to USD, you also need to query the USD price of token B and then convert it.
From the above formula, we can see that to calculate the data, we need to know the bin_step of a pool, the lower_bin_id and upper_bin_id of the position, as well as the decimals of the two tokens in the trading pair.
Continuing with the example of $trump (6p6xgHyF7AeE6TZkSmFsko444wqoP15icUSqi2jfGiPN), let's calculate the price range of a certain single-sided pool of this dev.
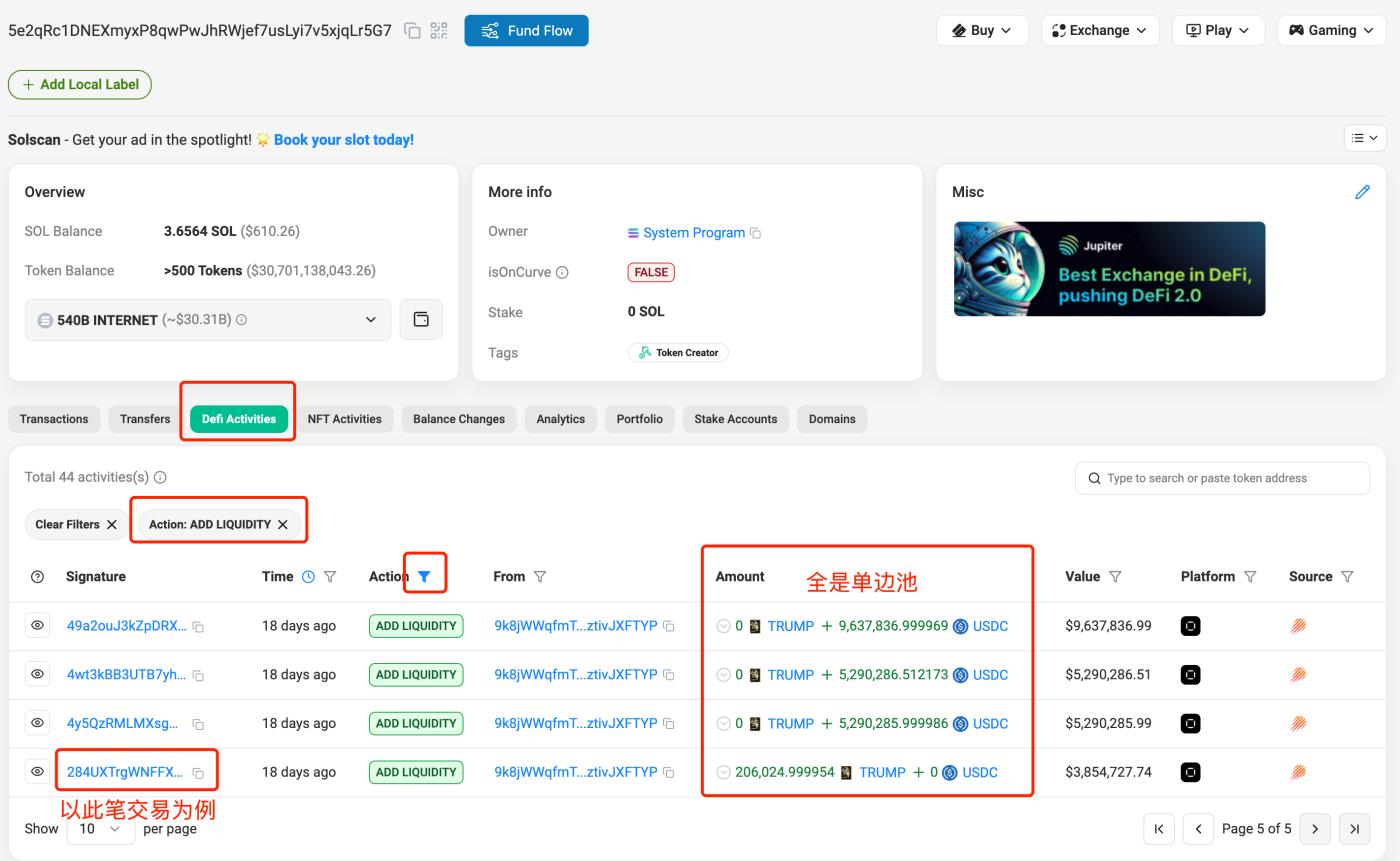
We open Solscan, enter the dev address of $trump (https://solscan.io/account/5e2qRc1DNEXmyxP8qwPwJhRWjef7usLyi7v5xjqLr5G7?activity_type=ACTIVITY_TOKEN_ADD_LIQ&page=5#defiactivities), open the [Defi Activities] tab, and filter the [Action] to "ADD LIQUIDITY". In the Amount column, we can see that all the listed liquidity addition transactions are single-sided pools, either only adding $trump or only adding $usdc. In this article, we will use the last transaction in the figure as an example.
Open the last transaction in the above figure (https://solscan.io/tx/284UXTrgWNFFXTovbCAQsJA8U5mW4rntwa8KyRvSmhNYf7cus1rtskiVqwNkErdosDMUsJfxXm8KgkCf1DzTPmPr), and you can see that this pool addition only added $trump, as shown in the figure.
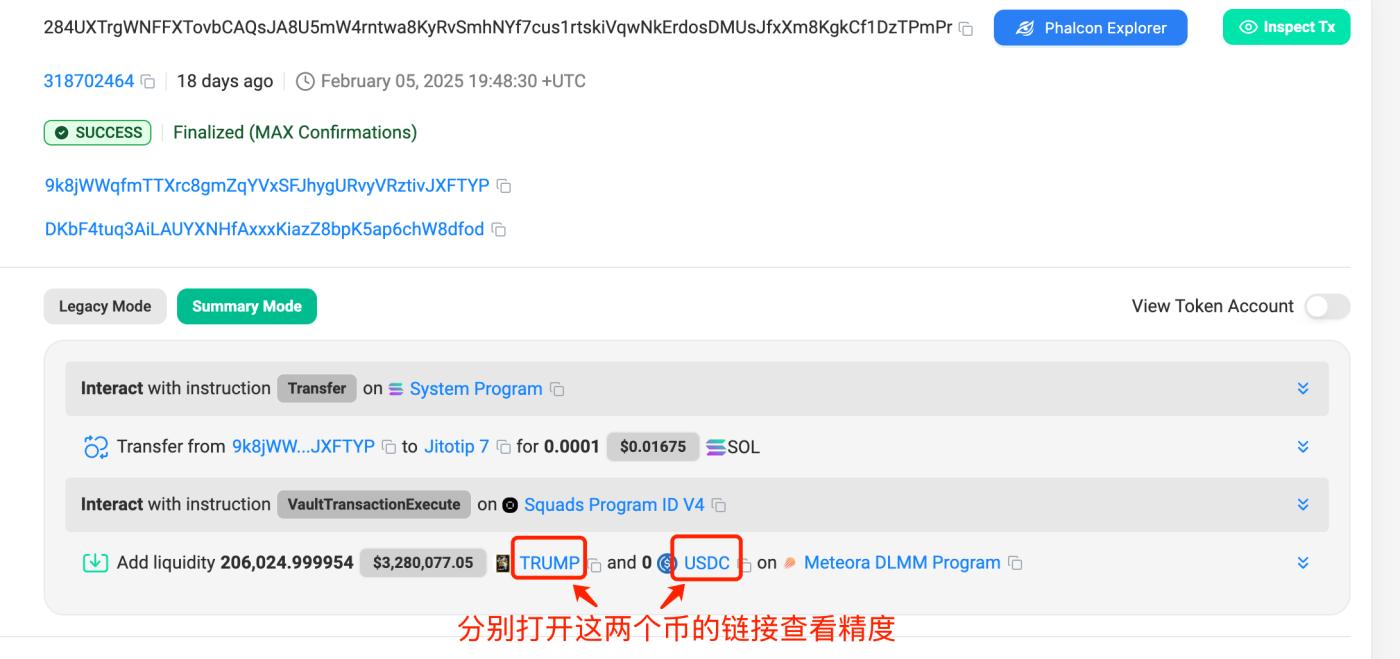
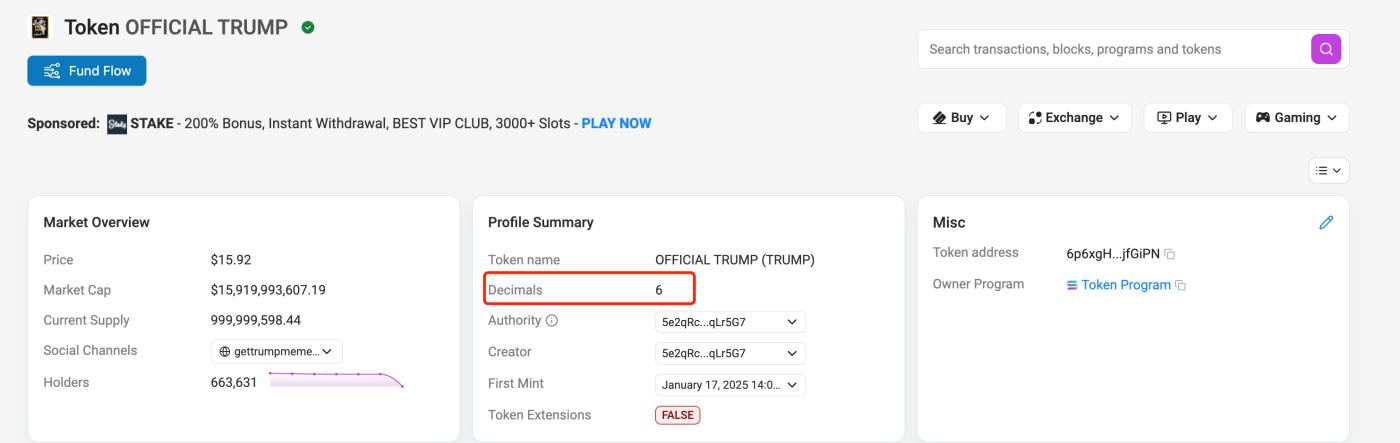
We open the links of $trump and $usdc respectively, and can find that the decimal of $trump is 6, and the decimal of $usdc is also 6, as shown in the figure.
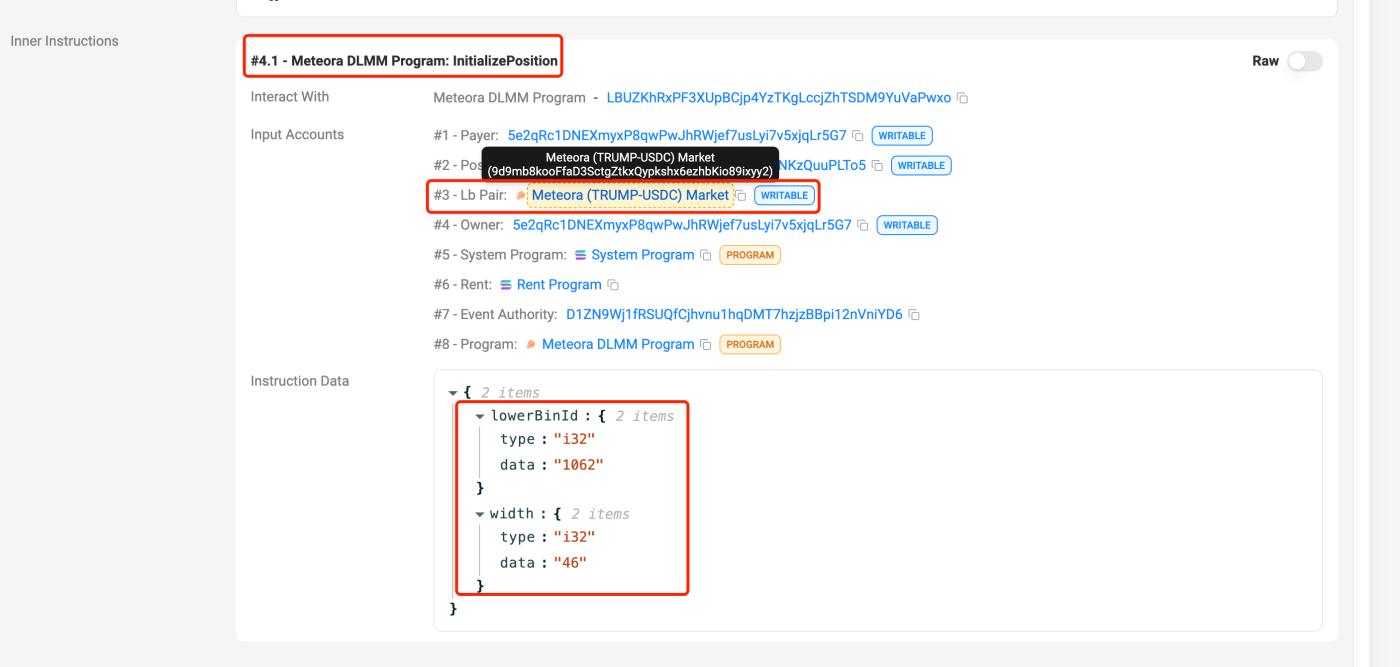
In the transaction details page, scrolling down to【#4.1 - Meteora DLMM Program: initializePosition】, you can see that the lowerBinId is 1062, the bin width or count is 46, and the pool address is 9d9mb8kooFfaD3SctgZtkxQypkshx6ezhbKio89ixyy2, as shown in the image. From the above information, you can calculate that the upperBinId = lowerBinId + width - 1 = 1062 + 46 - 1 = 1107
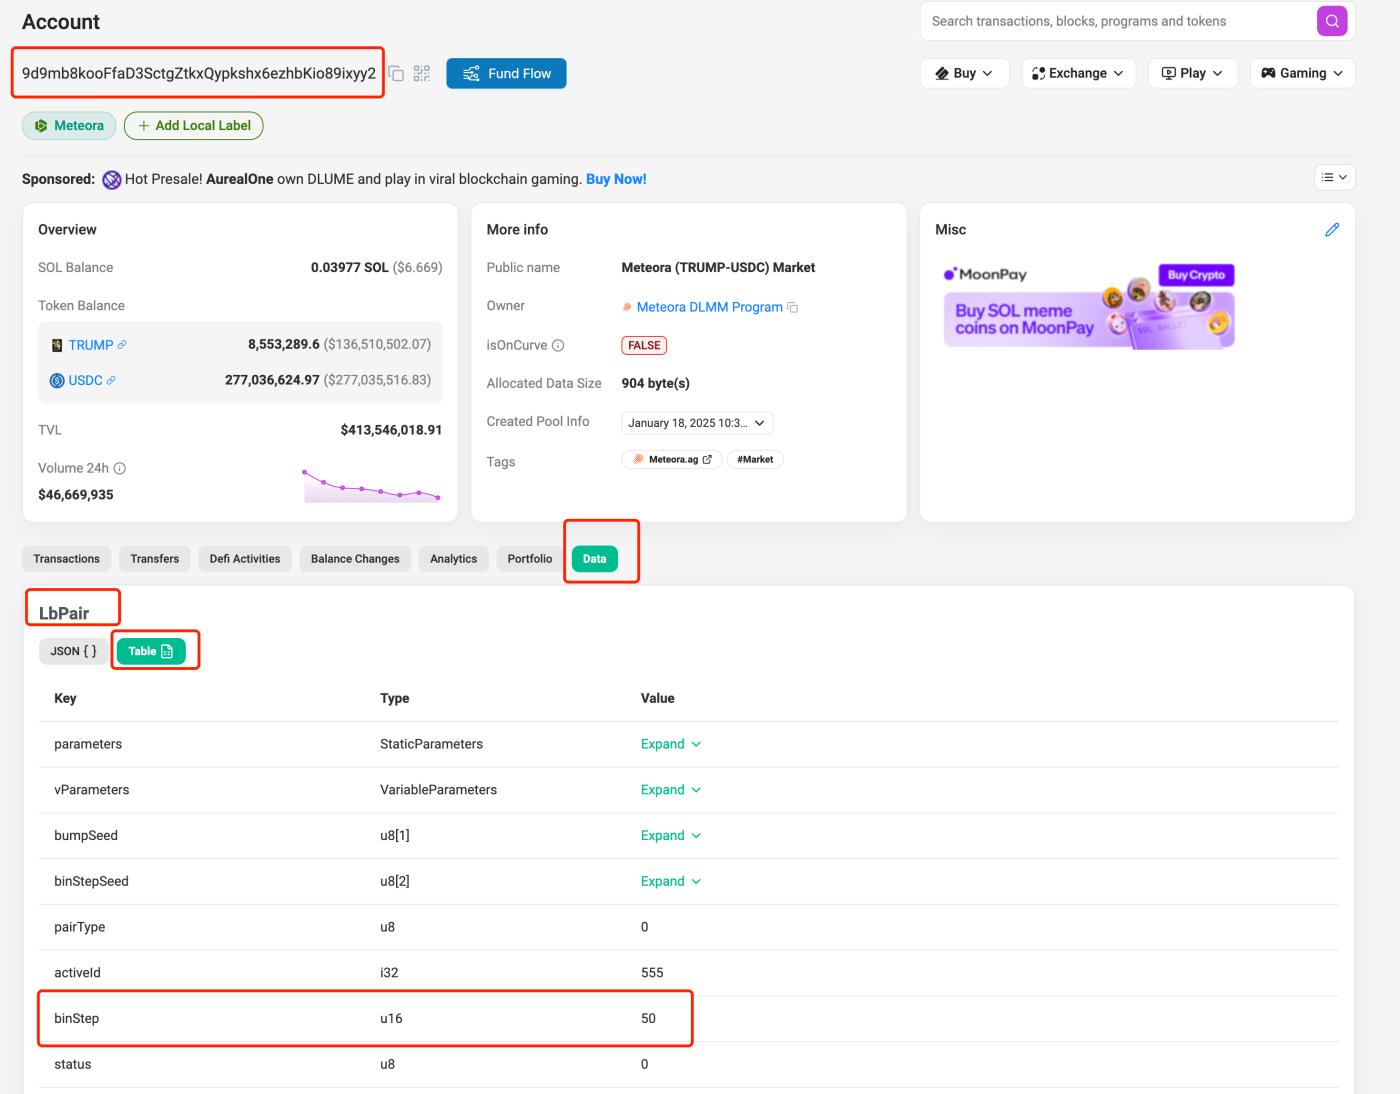
On Solscan, open the pool address 9d9mb8kooFfaD3SctgZtkxQypkshx6ezhbKio89ixyy2 (https://solscan.io/account/9d9mb8kooFfaD3SctgZtkxQypkshx6ezhbKio89ixyy2), click the "data" tab, and switch "LbPair" to "Table", you can find the value of binStep is 50, as shown in the image
From the above information, you can obtain all the data required for the calculation formula:
bin_step = 50
lower_bin_id = 1062
upper_bin_id = 1107
decimals_A = 6
decimals_B = 6
Then you can calculate:
Minimum price of the price range: min_price = (1 + bin_step/10000)^(lower_bin_id/10^(decimals_B-decimals_A)) = (1 + 50/10000)^(1062/10^(6-6)) = 199.6905832
Maximum price of the price range: max_price = (1 + bin_step/10000)^(upper_bin_id/10^(decimals_B-decimals_A)) = (1 + 50/10000)^(1107/10^(6-6)) = 249.9368917
The calculated price range is completely consistent with the price range shown in the second part of the image.
IV. Summary
Combining with monitoring tools, when we find that devs or other whales are adding single-sided liquidity pools, we can use the above method to calculate the price range they are preparing to sell or accumulate, and then make decisions based on the K-line and other data. The $libra issued by the Argentine President Milei also used the single-sided liquidity pool to sell, and you can use the above method to review the price range he added the liquidity at that time.
The tools I often use are debot, gmgn, and OKX, but these three tools are not very convenient when it comes to viewing liquidity. The ideal features would be:
1. List all the operations of the devs, including deposits, withdrawals, adding liquidity, and removing liquidity, and be able to identify and mark the transactions involving locking and adding/removing liquidity.
debot can identify all deposits and withdrawals, but not adding and removing liquidity;
gmgn can identify adding and removing liquidity, but cannot identify the devs' deposits and withdrawals, and also cannot identify the adding and removing liquidity transactions for the token "trump";
OKX has a liquidity pool change function, which lists adding and removing liquidity separately, but also cannot identify the devs' adding and removing liquidity transactions for the token "trump".
2. For each adding and removing liquidity transaction, be able to provide the specific price range, so that we don't have to calculate it manually.
3. When calculating the profit data of the devs, include the collected fees and the changes in funds when removing liquidity, so that we don't have to manually statistics the profit situation.
This feature is mainly possible to be realized by debot and gmgn, as they have done the profit data for each address.
I hope these tools can be improved to be more and more useful!