

Author:Bitcoin Magazine Pro
Compiled by: Bai Hua Blockchain
The price trend of Bit is usually analyzed through on-chain data, technical indicators, and macroeconomic trends. However, a severely underestimated but extremely important factor is Global Liquidity. Many investors may not fully utilize this indicator, and even have misconceptions about how it affects the cyclical trends of Bit.
1. The Impact of Global Liquidity on Bit
As discussions about global liquidity on platforms like Twitter (X) heat up, and analysts delve deeper into liquidity data, understanding the relationship between global liquidity and Bit prices has become a must-learn for traders and long-term investors. However, recent trends have deviated from traditional expectations, indicating that the market may require a more detailed analysis perspective.
Global M2 money supply refers to the total sum of all liquid money, including cash, demand deposits, and easily convertible near-money assets.
When global M2 expands, capital usually flows into high-yield assets, including Bit, stocks, and commodities, driving up prices.
Conversely, when M2 contracts, market liquidity tends to tighten, and risk assets often face downward valuation pressure.
In the current market environment, the traditional relationship between liquidity and asset prices may be changing, posing higher understanding requirements for investors.
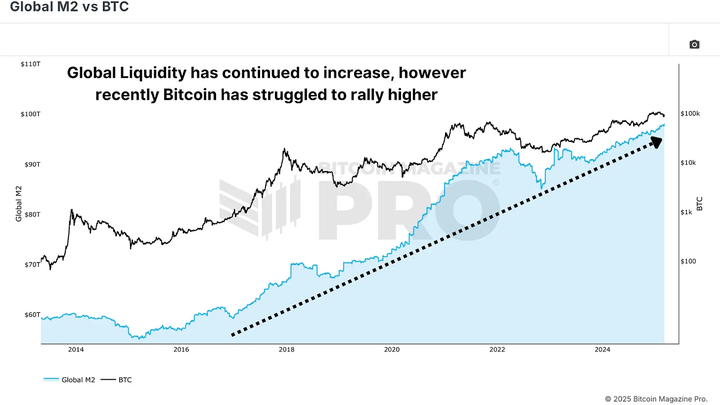
Figure 1: Global liquidity is rising, but Bit prices have recently declined
Historical Trend: Divergence between Bit Prices and Global M2 Trends
In the past, Bit prices typically rose with the expansion of global M2 money supply, and faced pressure when liquidity contracted. However, in this cycle, we have observed a clear divergence: despite the continued growth in global M2, the price trend of Bit has shown inconsistency.
2. Year-over-Year Change: A More Accurate Liquidity Metric
Rather than simply focusing on the absolute value of global M2, a more insightful approach is to analyze its year-over-year (YoY) change rate. This indicator reflects the speed of liquidity expansion or contraction, thereby revealing a clearer association between Bit price performance and liquidity.
When we compare Bit's YoY return with the YoY change in global M2, the correlation between the two becomes significantly stronger.
Bit's strongest bull market phases often occur during periods of rapid liquidity expansion.
Liquidity contraction typically precedes Bit price corrections or prolonged consolidation periods.
This finding suggests that investors need to pay closer attention to changes in the growth rate of global liquidity, rather than just the absolute level of liquidity.
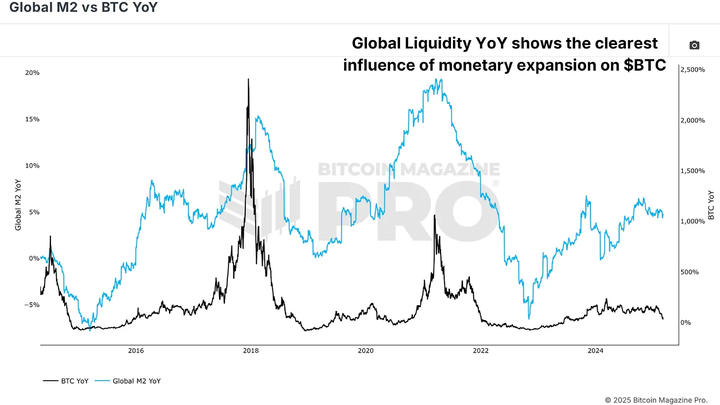
Figure 2: The annual change rate of global liquidity can more clearly reveal the liquidity cycle
For example, in the early 2025 consolidation phase of Bit, global M2 has been steadily growing, but its growth rate has stabilized. Only when the M2 expansion rate accelerates significantly, Bit may have the potential to break new highs.
3. The Lagging Effect of Liquidity
Another key observation is that the impact of global liquidity on Bit is not immediate. Research shows that Bit prices typically lag behind changes in global liquidity by about 10 weeks.
If the global liquidity indicator is shifted forward by 10 weeks, the correlation with Bit's price trend becomes significantly stronger.
Further optimization reveals that the most accurate lag period is around 56 to 60 days, or about 2 months.
This lagging effect means that when analyzing the impact of liquidity on Bit, investors need to consider the time delay, rather than just focusing on the current liquidity level.
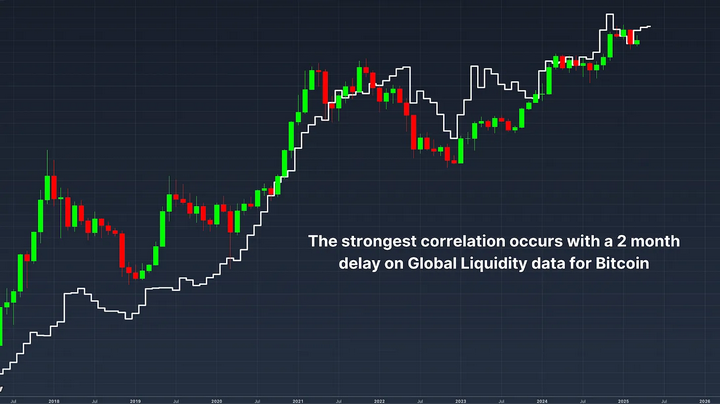
Figure 3: When liquidity data is lagged by two months, the correlation is strongest
4. Bit Outlook
For most of 2025, global liquidity has entered a sideways phase, after a strong expansion at the end of 2024 that drove Bit to new highs. This liquidity sideways period coincides with Bit's consolidation and pullback to around $80,000.
However, if historical trends continue to hold true, the recent rebound in global liquidity is expected to drive a new round of Bit rally around the end of March.
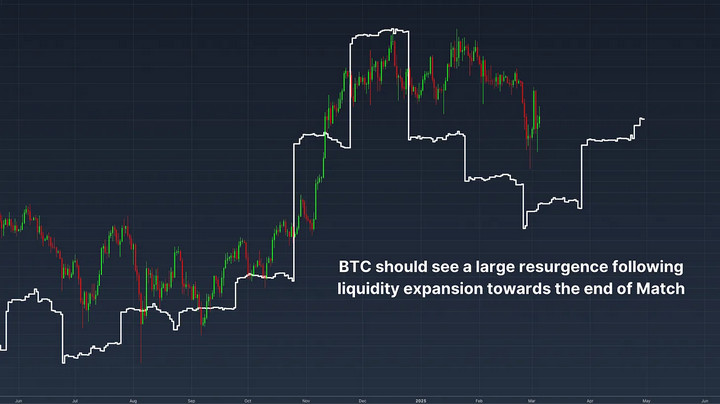
Figure 4: Liquidity is surging, but Bit may need a few more weeks to truly benefit
5. Conclusion
Global Liquidity is an important macroeconomic indicator for predicting Bit's price trends. However, rather than relying on static M2 data, a more effective approach is to focus on the change rate of M2, and understand that Bit prices typically lag the impact by about two months.
As the global economic environment changes and central banks adjust their monetary policies, Bit's prices will continue to be influenced by liquidity trends. The next few weeks are crucial - if global liquidity continues to accelerate, Bit may be in for a significant rally.


