

After reaching a peak of $2.99 on February 27, the Pi Network has fallen nearly 40% over the past two weeks. Technical indicators suggest that the momentum of PI is stabilizing.
The DMI shows that buying pressure has surged over the past two days, but the ADX has declined, indicating that the strength of the trend may weaken. Meanwhile, the RSI has spiked from oversold levels and is approaching overbought territory, which could either establish a bottom or lead to a sustained rise to key resistance levels.
Pi Network DMI, Uptrend Remains
The PI's DMI chart shows that the Average Directional Index (ADX) has declined from 36.5 to 30.6 over the past two days. ADX measures trend strength, and values above 25 generally indicate a strong trend, while values below 20 indicate a weak or corrective market.
As ADX rises, momentum is strengthened, and as ADX falls, the trend may weaken, even if price movements continue in the same direction.
The current decline in ADX suggests that PI is in an uptrend, but the momentum of this movement is weakening.
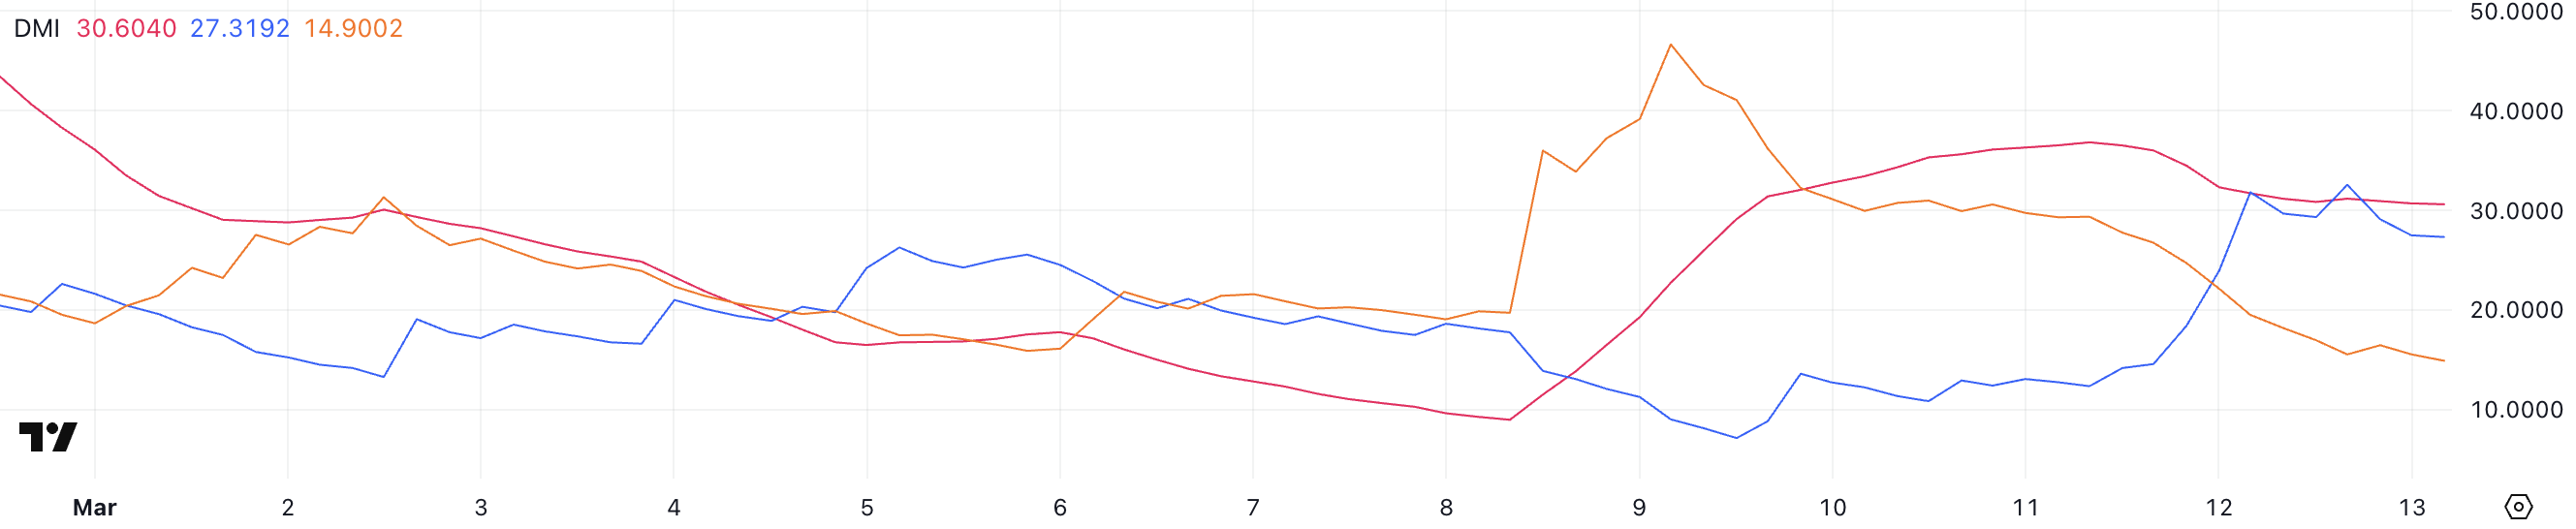
Looking at the directional indicators (+DI and -DI), +DI spiked from 12.3 to 27.3 two days ago but has since stabilized, while -DI has plummeted from 29.3 to 14.9. This change indicates that buying pressure has increased significantly over the past two days, overwhelming the previous selling pressure.
However, with +DI now stabilizing and ADX declining, the strong buying momentum previously seen may dissipate. This does not necessarily mean an immediate reversal, but it suggests that the uptrend may slow or enter a correction unless ADX rises again.
Pi Network RSI, Spiked Sharply in Recent Days
The Relative Strength Index (RSI) of PI has spiked from 34.8 yesterday to 60.90 today, up from 19.5 four days ago. RSI is a momentum indicator that measures the speed and magnitude of price movements on a scale of 0 to 100.
Generally, RSI values above 70 indicate an overbought state and suggest a potential correction, while values below 30 indicate an oversold state and often precede a price recovery.
A sharp rise from deep oversold levels to near 61 suggests a strong change in momentum and indicates that buyers are regaining control.
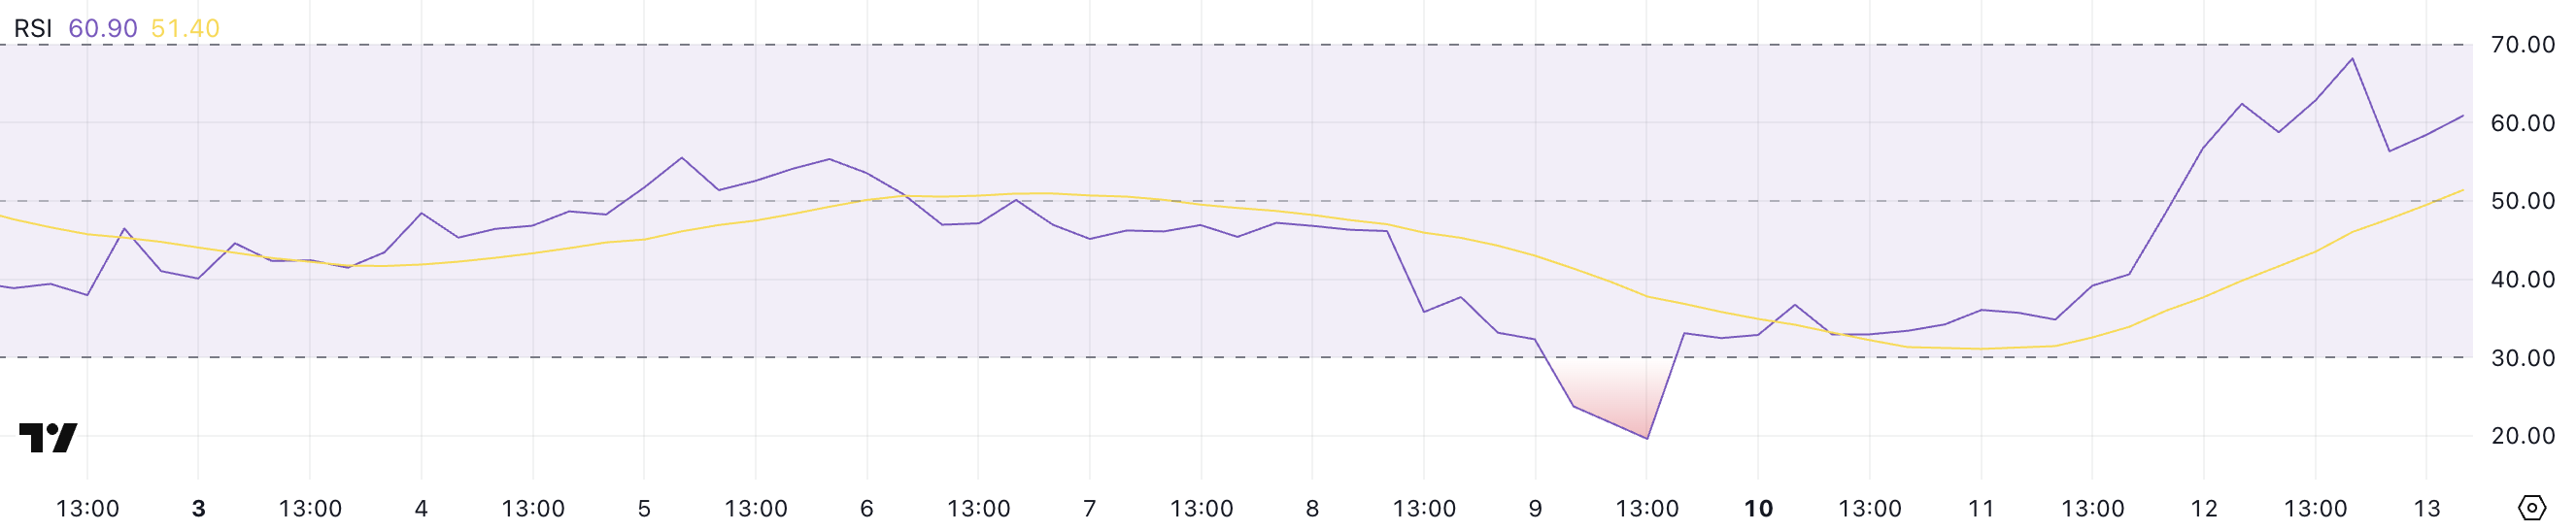
While PI's RSI has previously reached 68 and is currently at 60.90, approaching the overbought zone, it has not yet crossed the critical 70 threshold.
The fact that PI has not exceeded 70 since February 27 suggests that this level has historically acted as a resistance, and could potentially trigger profit-taking or a temporary slowdown.
If the RSI stabilizes at the current level, PI may establish a bottom and subsequently resume its uptrend. However, if it crosses 70, it would indicate an extreme bullish momentum, but also increase the likelihood of a short-term correction.
PI Capable of Recovering to $2.35 Level
PI's price is currently trading within a key range, facing resistance at $1.82 and finding support at $1.57. If the current uptrend continues and buyers push past $1.82, the next target would be $1.98.
Surpassing this level, especially if PI regains the positive momentum it had last month, could lead to a stronger rally that could push the price up to $2.35, strengthening the bullish outlook.
However, breaking through these levels would require sustained buying pressure and a confirmed breakout above $1.82.
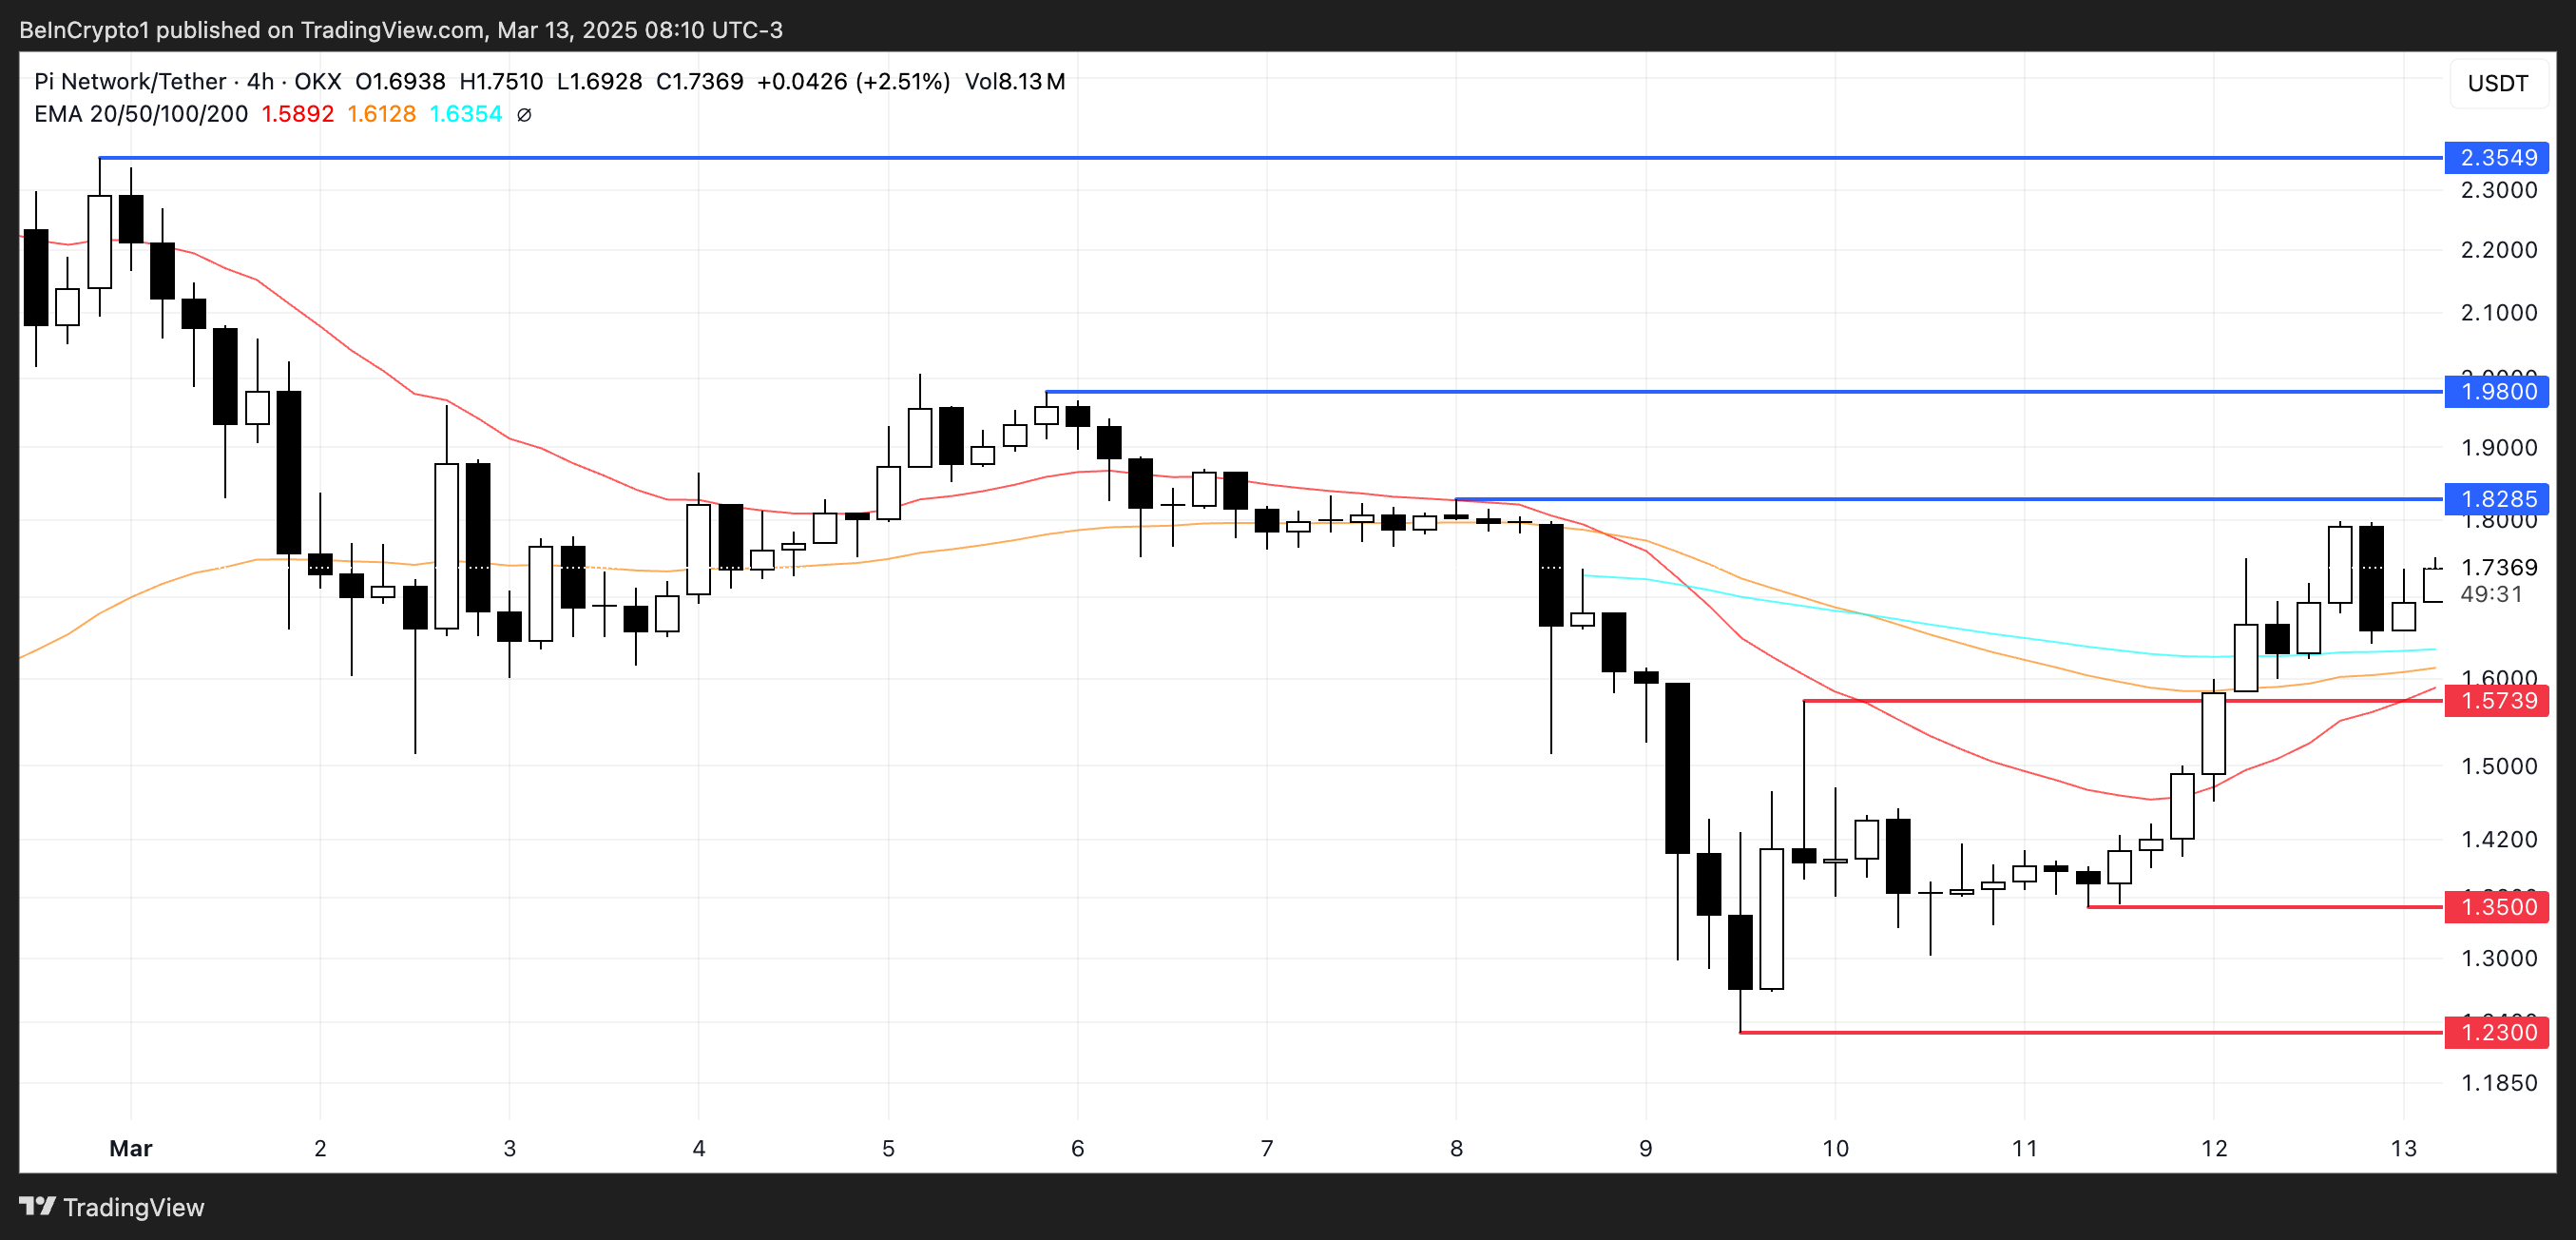
If the trend reverses, PI could immediately test the immediate support at $1.57.
Losing this level would weaken the bullish structure, and the price could be exposed to further downside, potentially testing $1.35. If selling pressure intensifies, PI could even drop to $1.23, indicating a deeper correction.
The strength of the $1.57 support level is crucial in determining whether the current uptrend will be maintained or if PI will enter a longer correction.


