Solana (SOL) has fallen by more than 6% over the past 7 days and has been trading below $150 since March 6th. The current trend shows clear downward signals across multiple indicators.
From the death cross to the rising ADX and the red Ichimoku cloud, technical analysis suggests increasing downward pressure. As SOL approaches a key support line, the next few days could be crucial in determining its price direction.
SOL Ichimoku Chart, Bearish Picture
Solana's Ichimoku chart shows a clear downward structure, with the price trading below the baseline (red line) and the conversion line (blue line).
The lagging span (green line) is also positioned below the price candles and the cloud, reinforcing a negative outlook. The preceding cloud is red and declining, suggesting strong resistance remains in the short term.
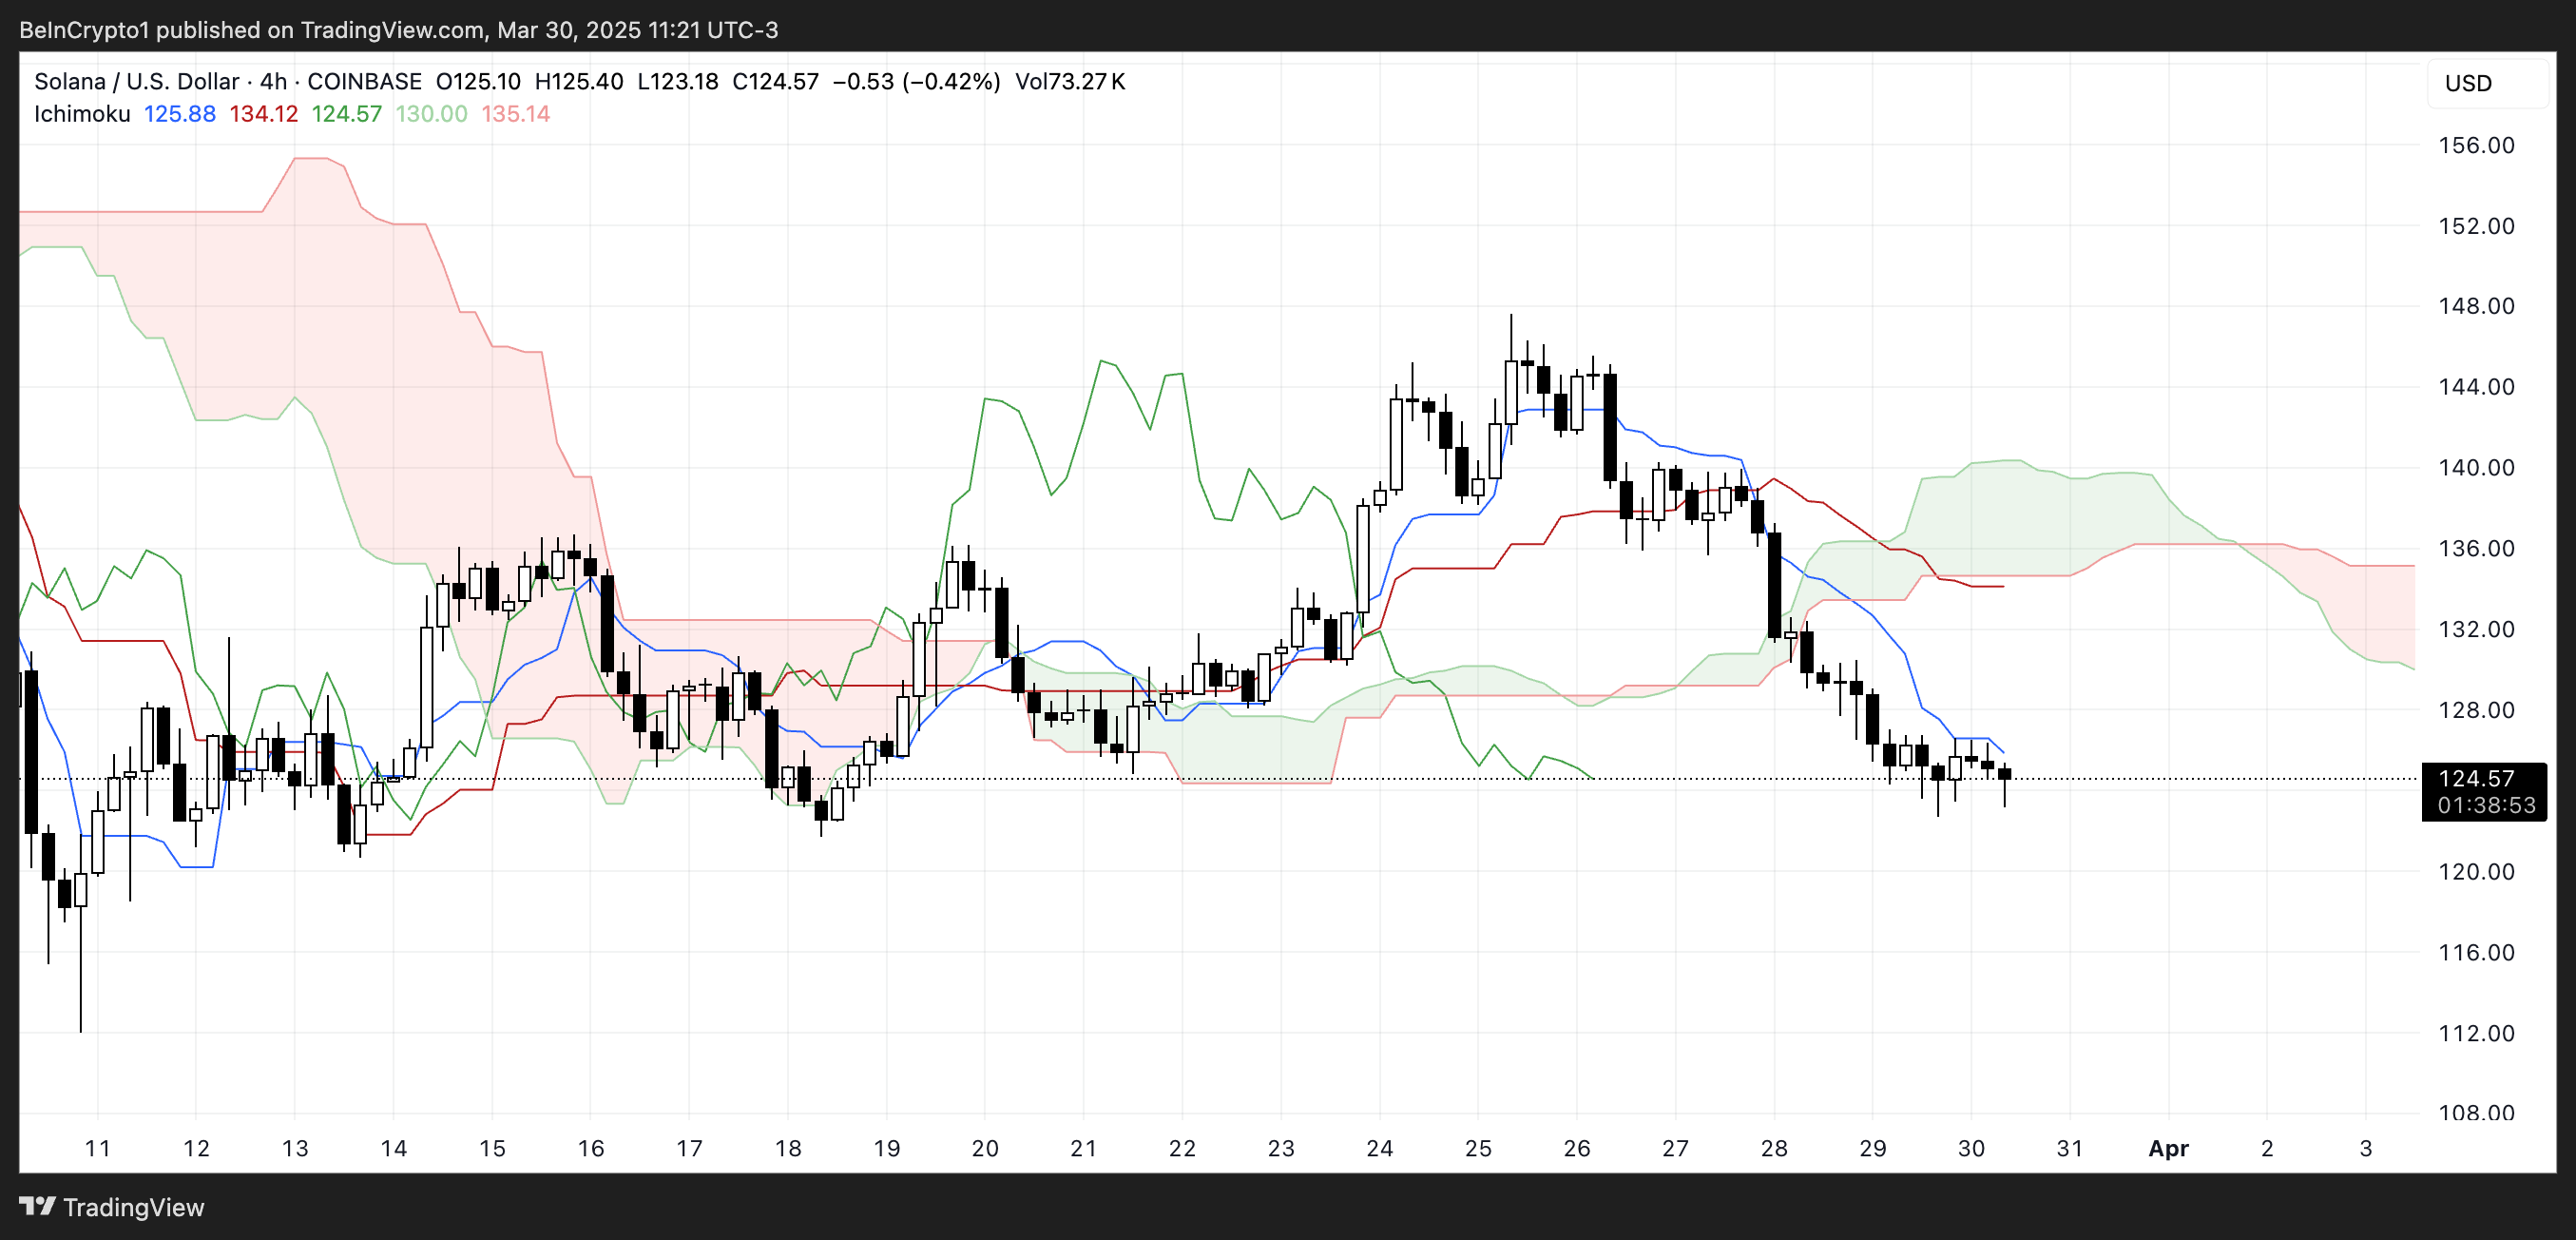
Solana is struggling to break through short-term resistance levels and is trapped in a downward channel. The thin nature of the current cloud suggests weak support, and if the downward momentum continues, the price could be vulnerable to further decline.
To reverse, Solana needs to break through the baseline and push decisively towards the cloud, but currently, the downward trend continues.
Solana DMI, Selling Pressure Prevails
Solana's DMI chart shows the ADX rising sharply to 40.87, up from 19.74 three days ago.
ADX (Average Directional Index) measures trend strength, with 25 and above indicating a strong trend, and 40 and above signifying a very strong trend.
This sharp increase confirms that SOL's current downward trend is gaining momentum.
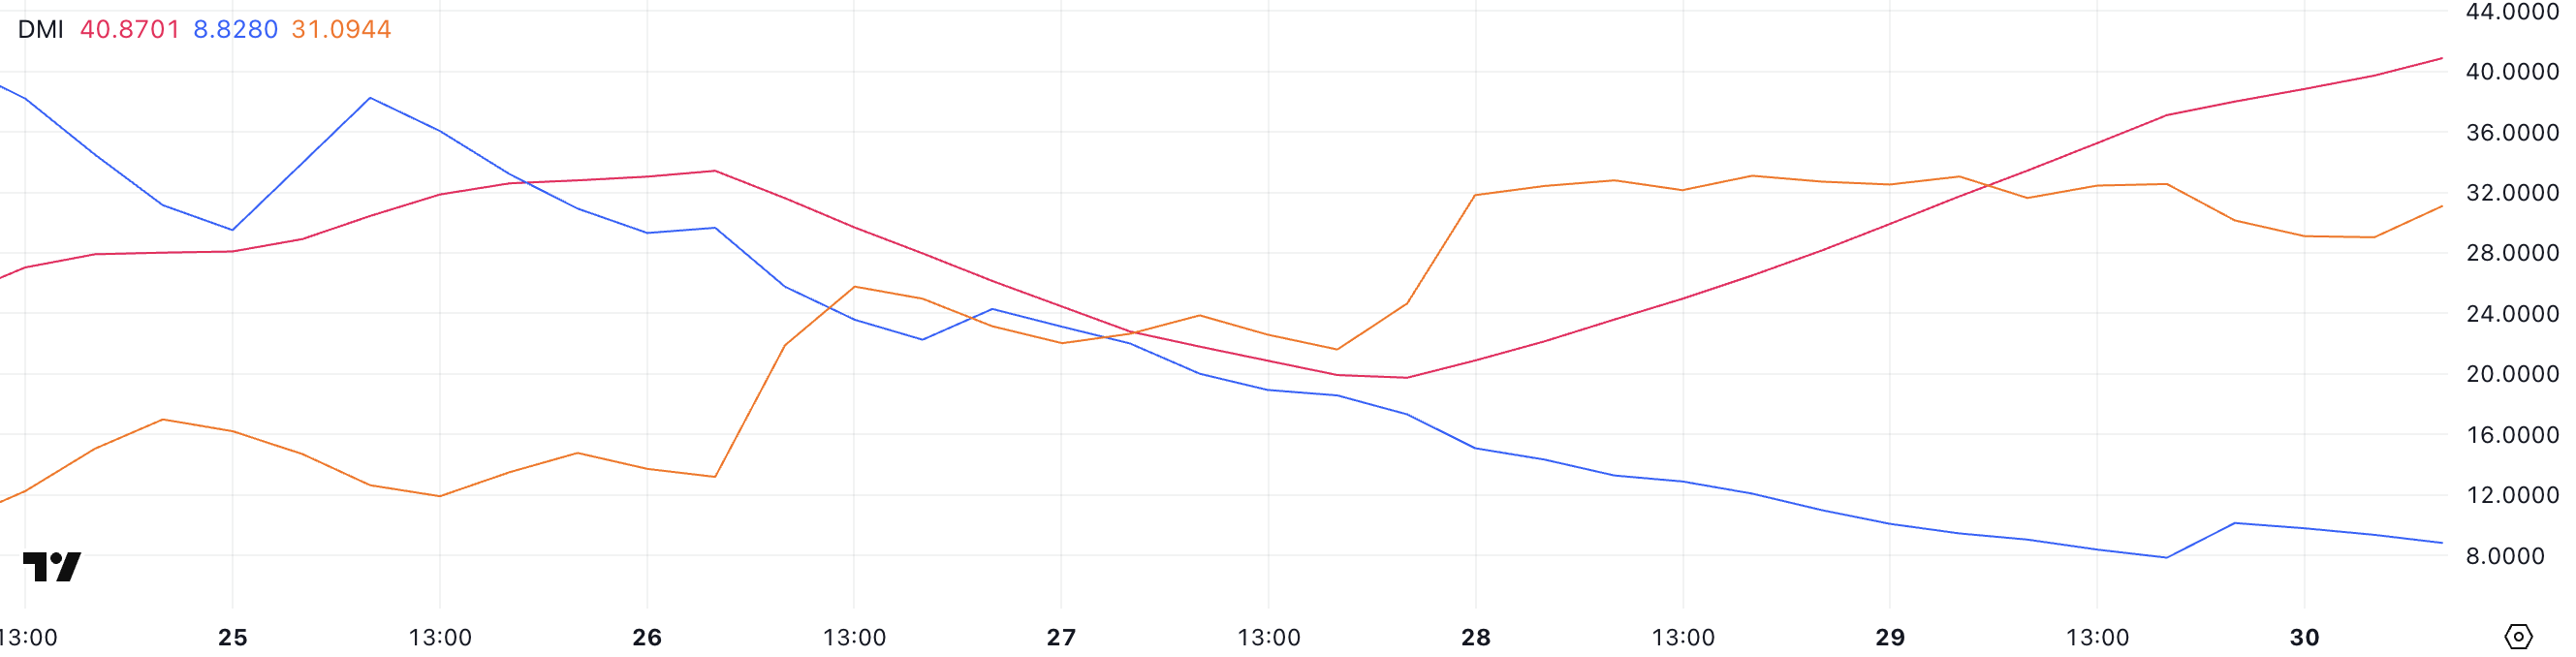
Simultaneously, +DI has dropped from 17.32 to 8.82, while -DI has risen to 31.09 and remained stable over the past two days.
This setup suggests that sellers are firmly in control, and the downward trend is strong and intensifying.
As long as -DI remains dominant and ADX stays high, SOL is likely to face pressure in the short term.
Will Solana Soon Drop Below $110?
Solana has recently formed a death cross, with the short-term moving average crossing below the long-term moving average.
It is approaching the major support line at $120, and if this level breaks, the Solana price could fall to $112 and potentially drop below $110 for the first time since February 2024.
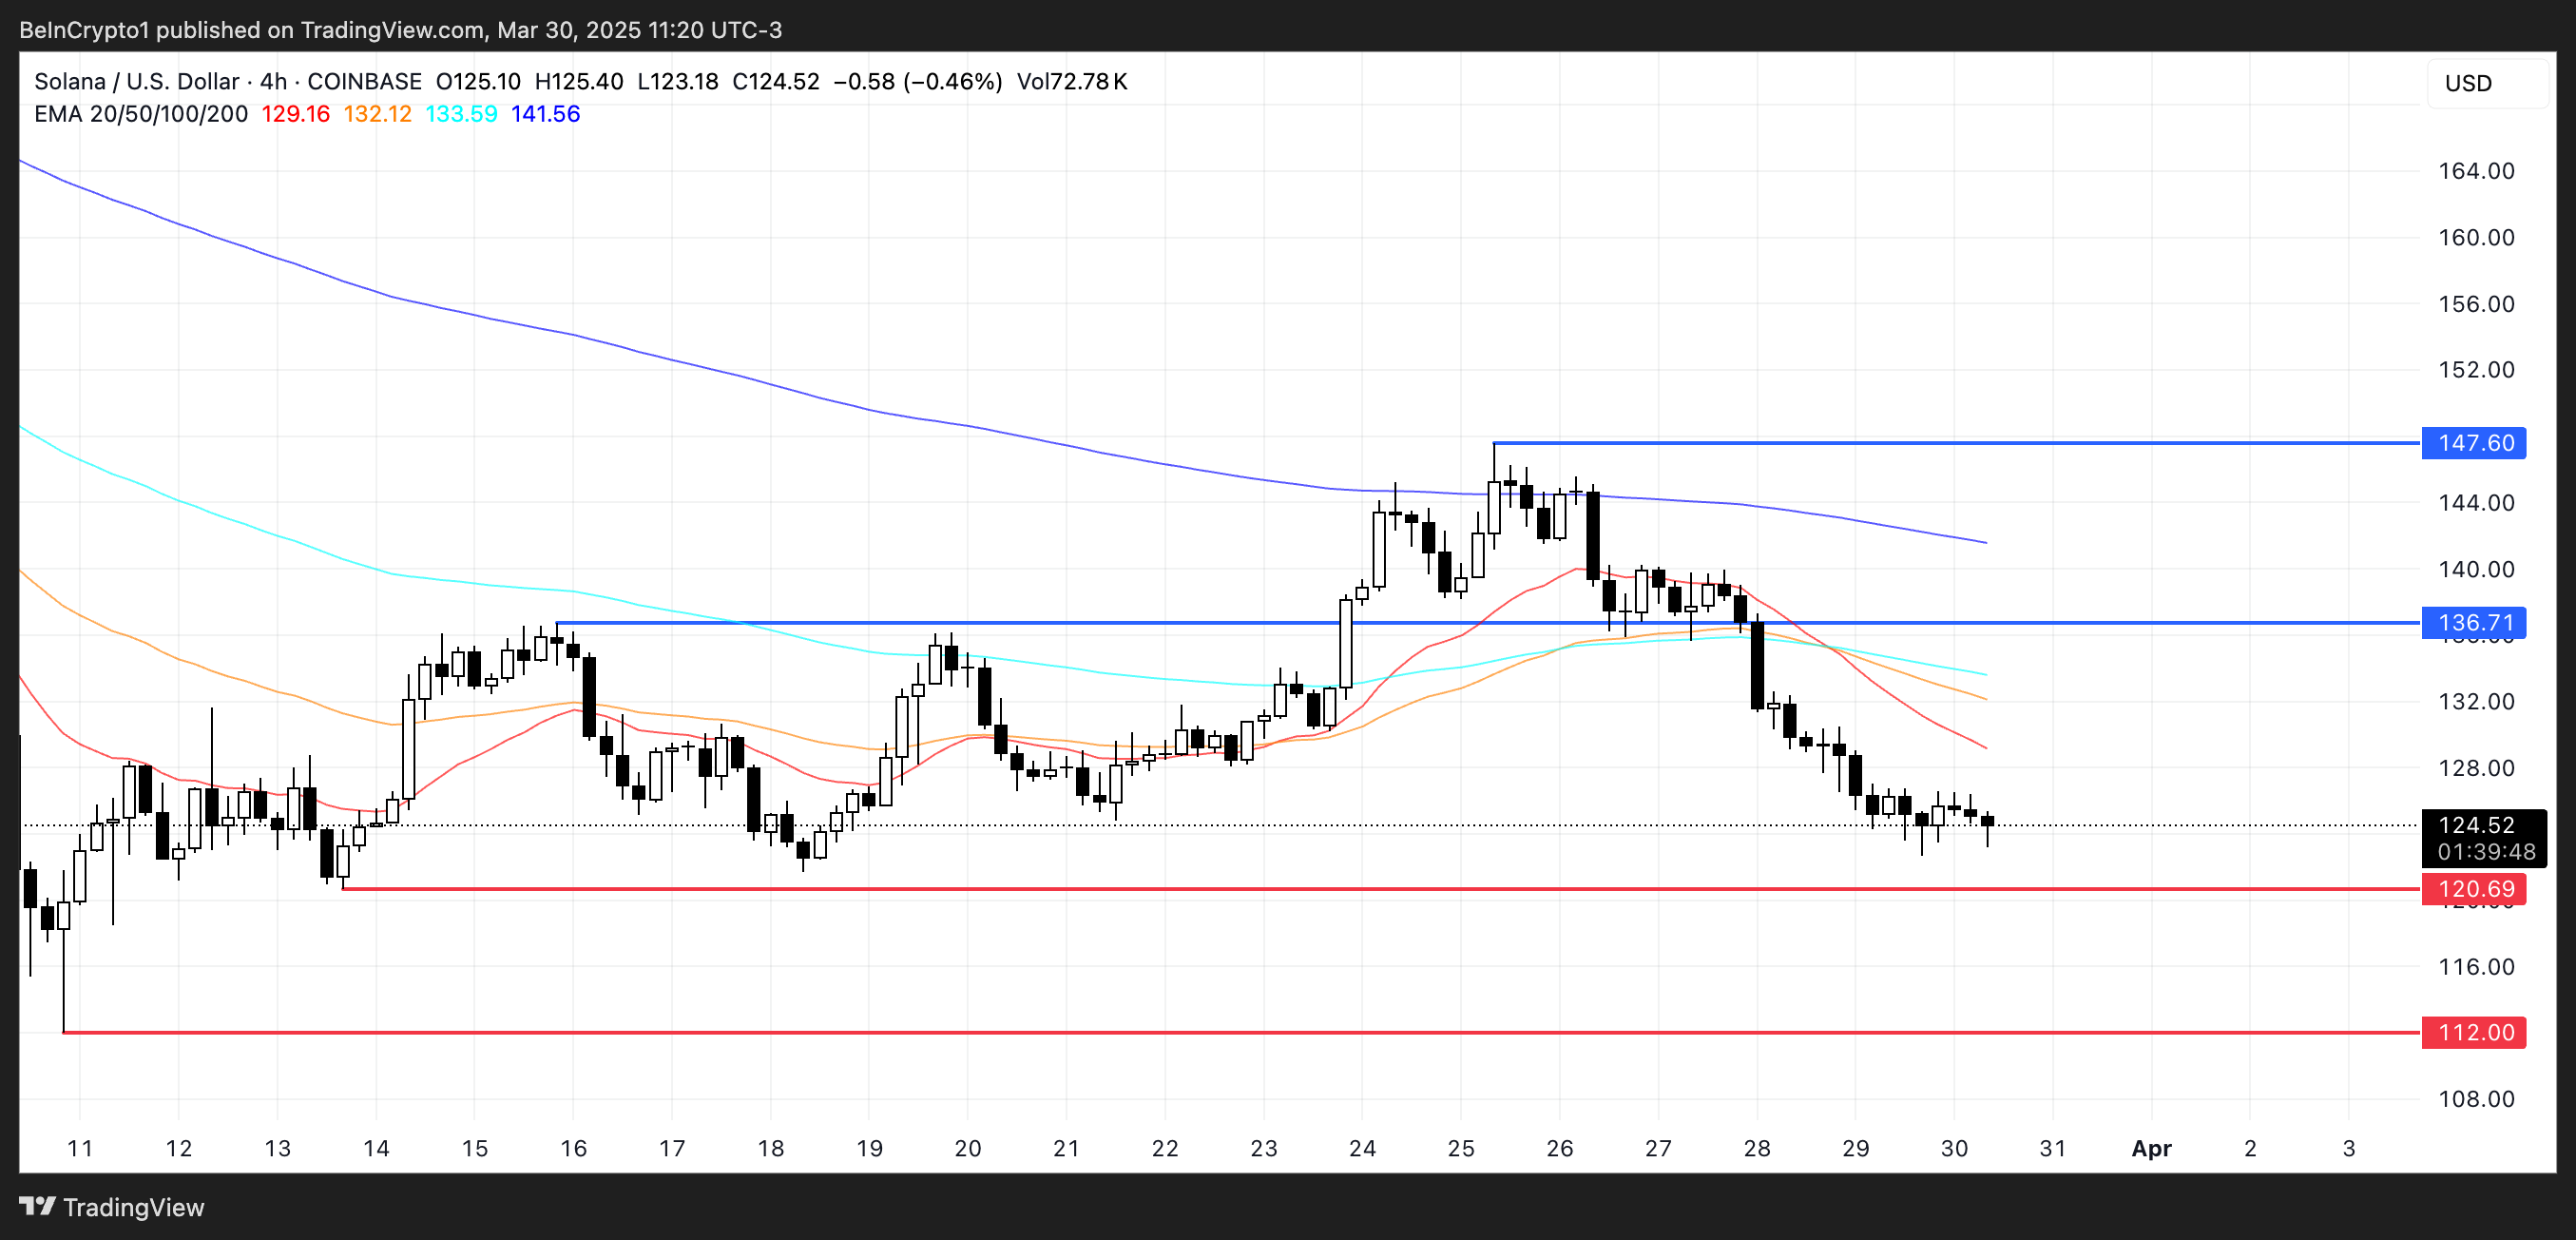
If buying pressure returns, SOL could rebound towards the $136 resistance level.
If it breaks through that level, it could push towards $147, which was a strong resistance point five days ago.