

PI has been in a continuous downtrend since reaching its All-Time-High of $3 on 26/02/2025. In fact, it has been trading below the downtrend line since 12/04/2025, showing a negative bias towards this altcoin.
However, the situation may be changing. Current technical indicators suggest a potential price recovery, hinting at a short-term PI rebound.
PI's Quiet Accumulation Phase Could Trigger a Price Surge
BeInCrypto's analysis of the PI/USD daily chart suggests the altcoin may be preparing for a potential price breakout. For example, its on-balance volume (OBV) has surged over the past two days, showing early accumulation signs.
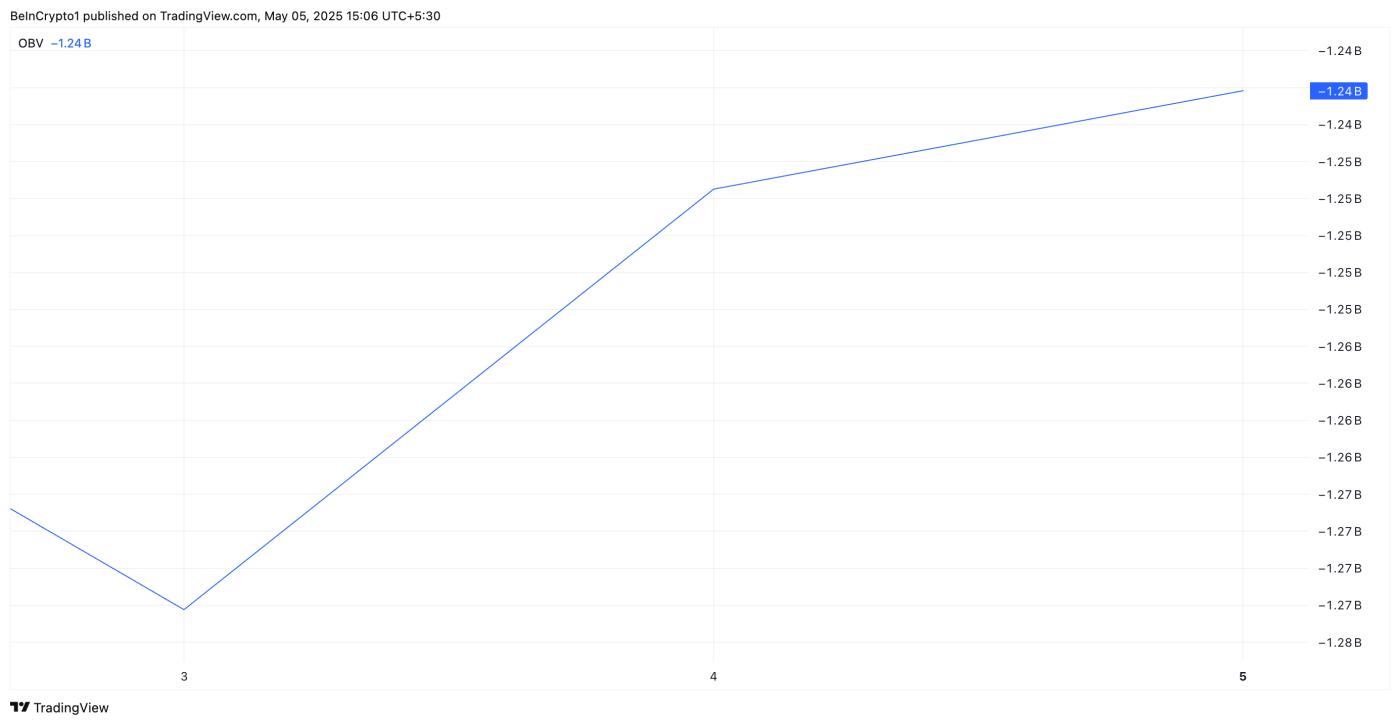 PI OBV. Source: TradingView
The OBV indicator uses trading volume to predict price movements, adding volume on up days and subtracting on down days. When its value increases like this, it indicates buying pressure is increasing.
OBV is considered a leading indicator, meaning it often moves before price action and can signal market sentiment changes before they're reflected in asset prices. Therefore, PI's rising OBV suggests buyers are quietly accumulating the token, even while its price remains low.
This divergence signals that upward momentum is forming, increasing the likelihood of PI's breakout as broader market sentiment aligns.
Moreover, the red bars on PI's BBTrend indicator have been gradually shrinking. This reduction suggests selling pressure is weakening, an early signal that the current downtrend may be losing momentum.
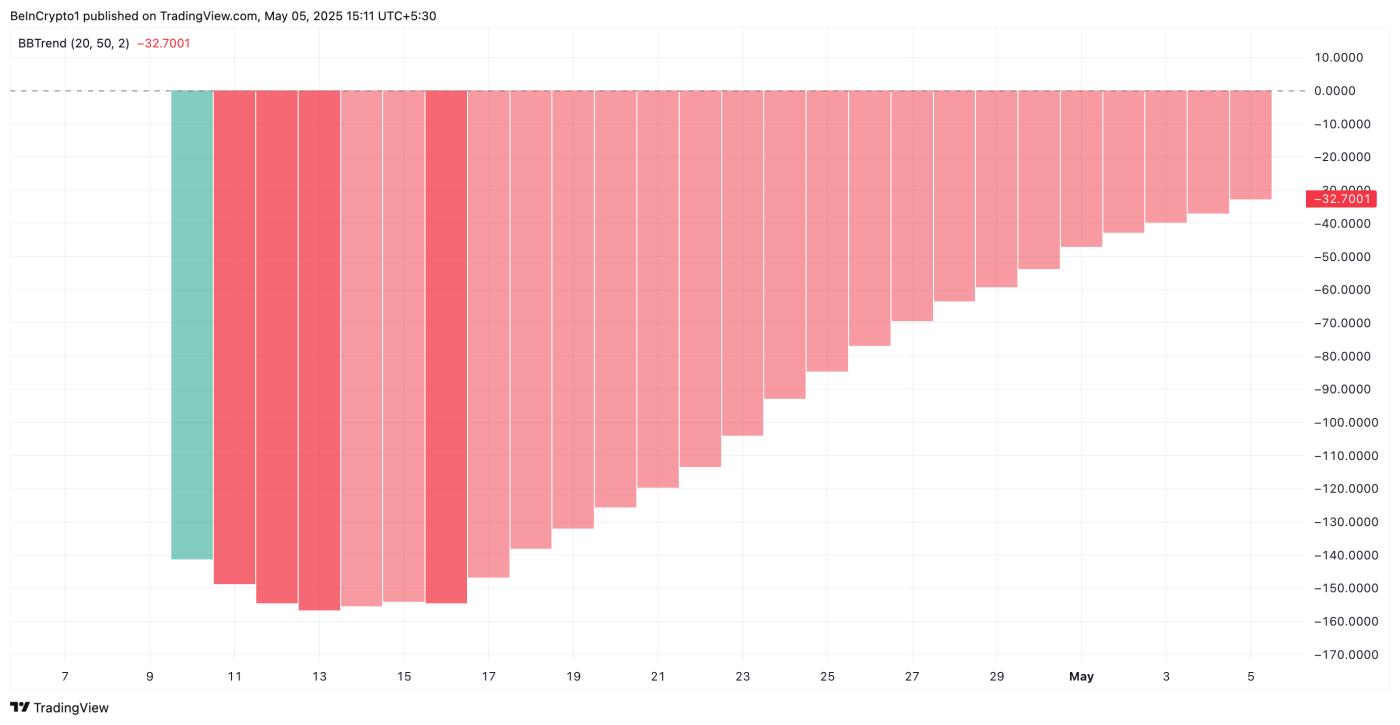 PI BBTrend. Source: TradingView
In technical analysis, contraction in the BBTrend chart is a sign of potential trend reversal, especially when accompanied by increased volume and other bullish indicators.
As the bars shorten, this indicates stabilizing volatility in the PI market and an increasingly likely price shift towards an upward trend.
PI Likely to Reverse with Bullish Signals Pointing to $1 Breakout
Currently, PI is trading at $0.591, below the downtrend line, forming a resistance level at $0.605. If buying pressure increases strongly and PI demand surges, it could transform this price point into a support level and climb to $1.01.
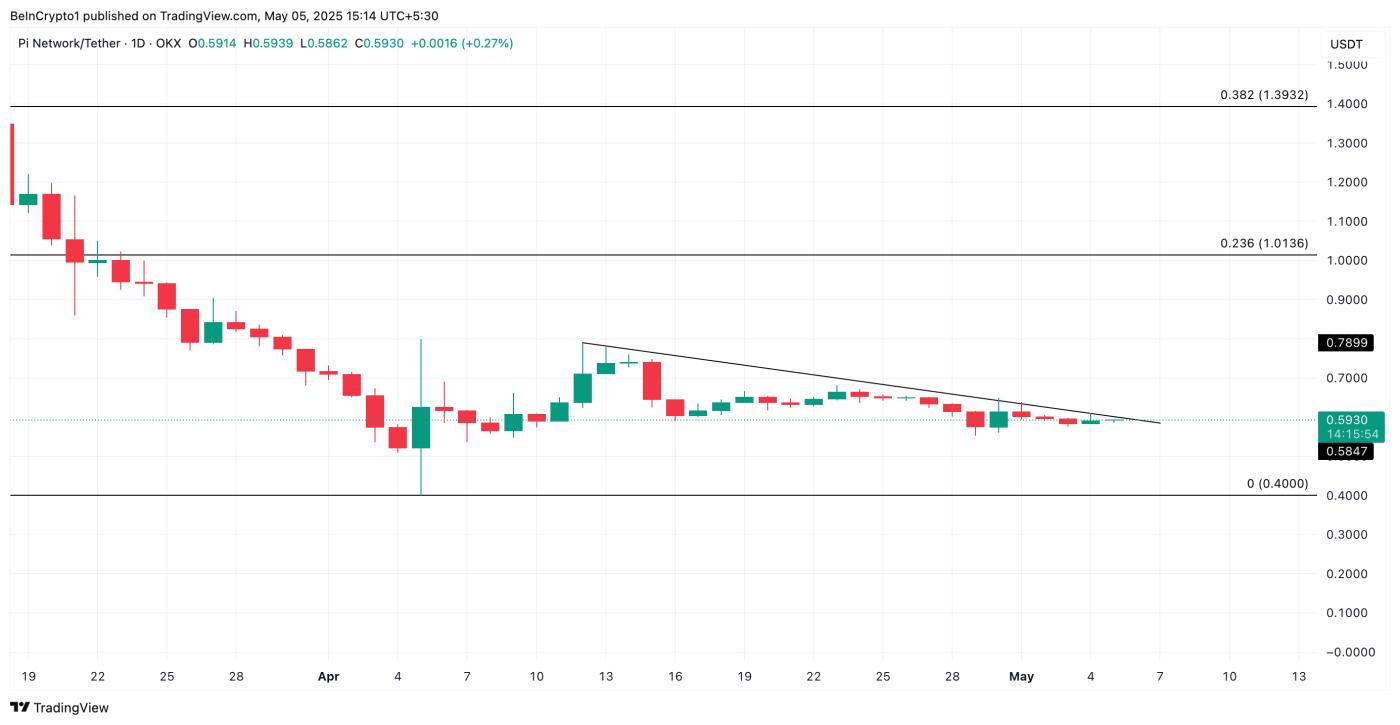 PI Price Analysis. Source: TradingView
On the other hand, if selling continues, the PI token could return to its All-Time-Low of $0.40.


