

If traders had a magic crystal ball, their biggest wish would be knowing how to buy XRP at the bottom. Especially in cryptocurrencies, the mantra "When are we going to the moon?" still remains. Translation: "Have we finally reached the bottom?"
First, a note of caution: Some technical analysis tools and methods discussed here may differ from conventional wisdom. Because, like in other fields, trading theories and best practices also evolve. It may take years for these updated practices to spread from experts to retail traders. Sometimes even experts take time to adopt such changes!
In this article, we will analyze the anatomy of the market bottom using XRP, one of the most widely recognized cryptocurrencies.
First and foremost
News is anecdotal.
This is a polite way of saying "news is not important". If you pursue professional certifications like CMT (Certified Market Technician) or CFTe (Certified Financial Technician), you will explore works like James Montier's "Behavioral Investing". This book deals with the impact of news on markets.
In summary, news is only important when prices move. If prices do not react meaningfully, news is irrelevant. People simply look for news as an explanation or reason for what happened.
If you want to buy XRP at the bottom, there are several tools to help you identify and time this correctly. The two tools I will focus on are RSI and Stocktwits' social sentiment data.
RSI, Context Over Blind Numbers
If you want to buy XRP at the bottom, RSI can help. Note: You were probably using RSI incorrectly. At least, not using it as efficiently as possible. But don't feel bad. The way professionals interpret RSI changed almost 20 years ago. However, even experts sometimes take time to adapt.
RSI (Relative Strength Index) is one of the most familiar and widely used indicators among traders.
In 1978, J. Welles Wilder introduced RSI. It was revolutionary at the time because RSI thrives in range-bound markets. This precisely matches what investors experienced in Wilder's era:

Updated RSI Usage
In 2008, Connie Brown, considered one of the world's best analysts and traders, revolutionized the understanding of RSI in her book "Technical Analysis for the Trading Professional". (Essential reading for certifications like CMT and CFTe.)
Without going into details, RSI is now considered to be in a bullish or bearish market. Each tool and timeframe is slightly different, but general OB (overbought) and OS (oversold) levels are as follows:
Bullish Market:
- OB 1 – 80
- OB 2 – 90
- OS 1 – 50
- OS 2 – 40
Bearish Market:
- OB 1 – 65
- OB 2 – 55
- OS 1 – 30
- OS 2 – 20
For example: XRP Daily Chart from May 2019 to June 2020
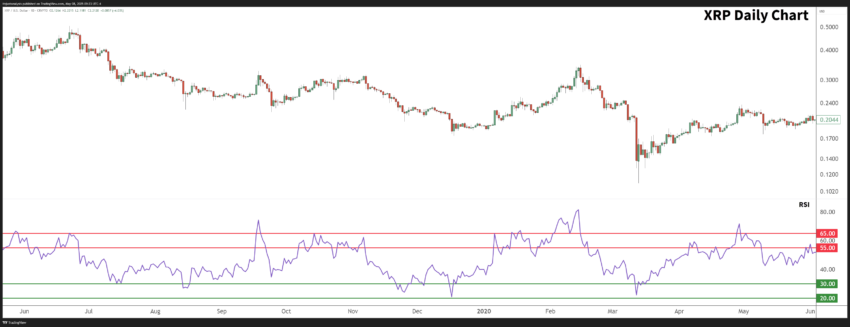
Particularly during this period, the RSI level of 65 acted as a relatively consistent resistance, while 30 and 20 acted as support.
But how can you tell if RSI is bullish or bearish? It's simple – overlay these levels and see which fits better with recent movement.
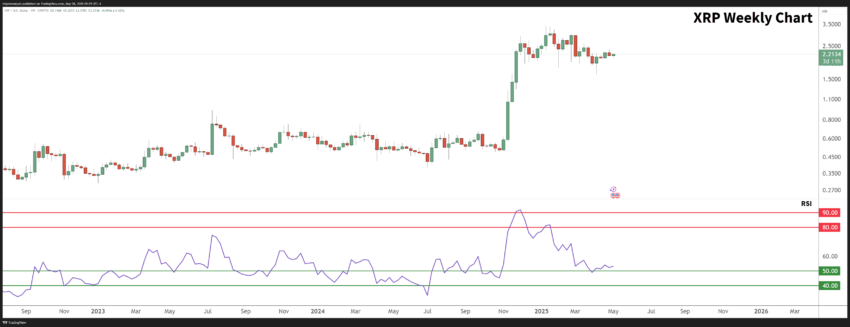
Looking at XRP's weekly chart now, my interpretation is that it's bullish because it respects the 50 OS level as support.
Stocktwits SNS Sentiment… Cheat Code?
Stocktwits' social sentiment data is a powerful tool when buying XRP at the bottom. Stocktwits captures insights only from traders and investors – no random conversations from general social media.
What I particularly find valuable is:
- If message volume increases but sentiment remains flat or declines, I look for an upward trend. People often talk about something before actual action.
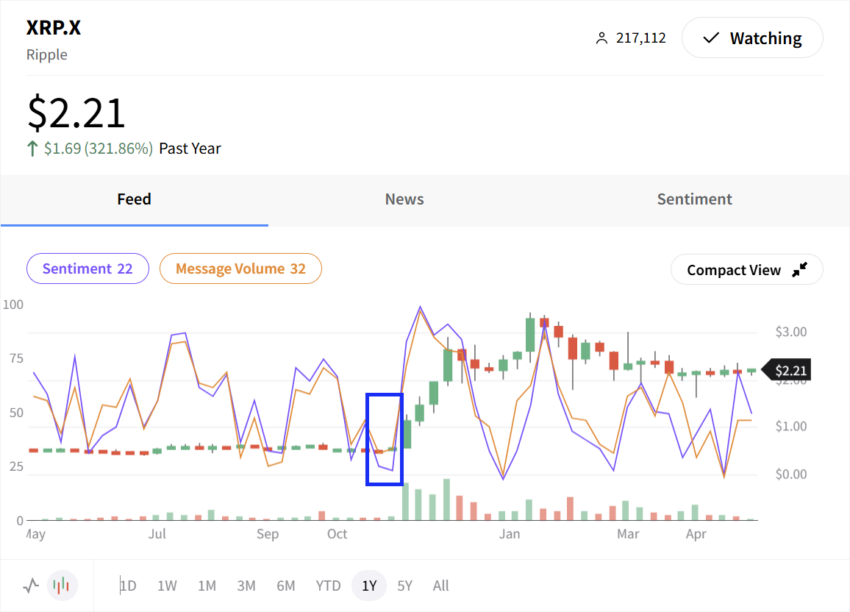
November 2024 perfectly demonstrates this:
- Week of October 27: Sentiment 24, Volume 30
- Next week: Sentiment drops to 22, Volume slightly increases to 32
This sentiment/volume difference generally signals upcoming upward momentum.
Recent XRP Sentiment Activity
Currently, there's an even more dramatic difference:
- Message volume (orange) is flat or slightly increasing
- Sentiment is declining, despite XRP's price being in an upward trend
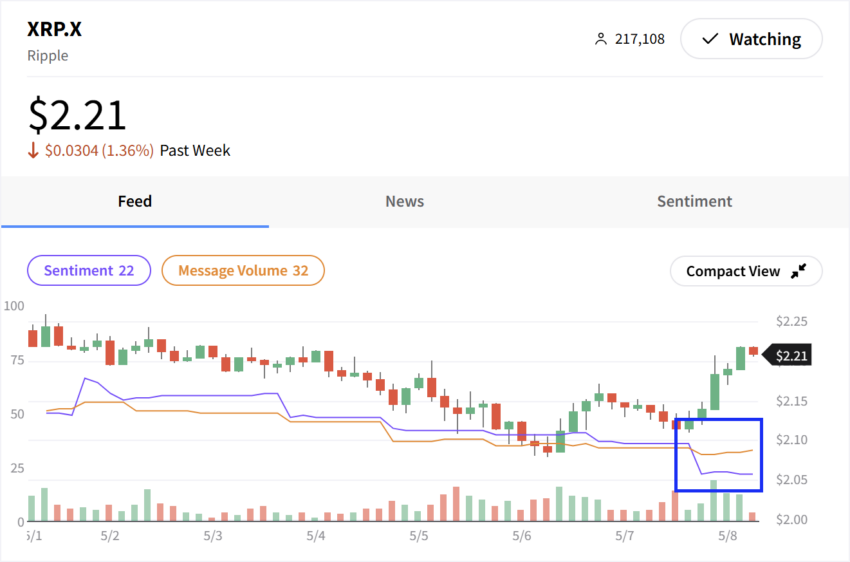
Another key pattern: When price is flat and sentiment steadily declines, it indicates traders are late in recognizing market direction. For me, this is not just a participation signal, but a signal to secure a good position before others rush in.
In summary, identifying market bottom is not about being first, but about understanding context, utilizing the latest analysis methods, and decoding subtle market sentiments. This is the trick to identifying the bottom.


