

The cryptocurrency market witnessed a decline in investor sentiment last week, with a significant drop in trading activity across major assets and altcoins. This pushed the total cryptocurrency market capitalization down by 106 billion USD in the week.
Amid this decline, some tokens recorded increases while others struggled. Below is a look at the top weekly winners and losers.
Top Gainers in the Crypto Market
Onyxcoin (XCN) and Bitget Token (BGB) emerged as top winners last week, despite the broader market trend. Both tokens recorded strong increases, driven by investor interest and optimistic technical setups.
Onyxcoin (XCN)Among the top 100 cryptocurrencies by market capitalization, XCN is the altcoin with the highest increase over the past week. Currently trading at 0.019 USD, the token's value has increased by nearly 10% over the past seven days.
On the daily chart, indicators from Moving Average Convergence Divergence (MACD) suggest a potential short-term continuation. At the time of writing, XCN's MACD line (blue) is above the signal line (yellow) and zero lines.
An asset's MACD indicator determines its trend and momentum in price fluctuations. It helps traders detect potential buy or sell signals through intersections between the MACD and signal lines. With this setup, buying activity dominates the market, supporting potential price increases.
If the price increase continues, XCN's price could reach 0.023 USD.
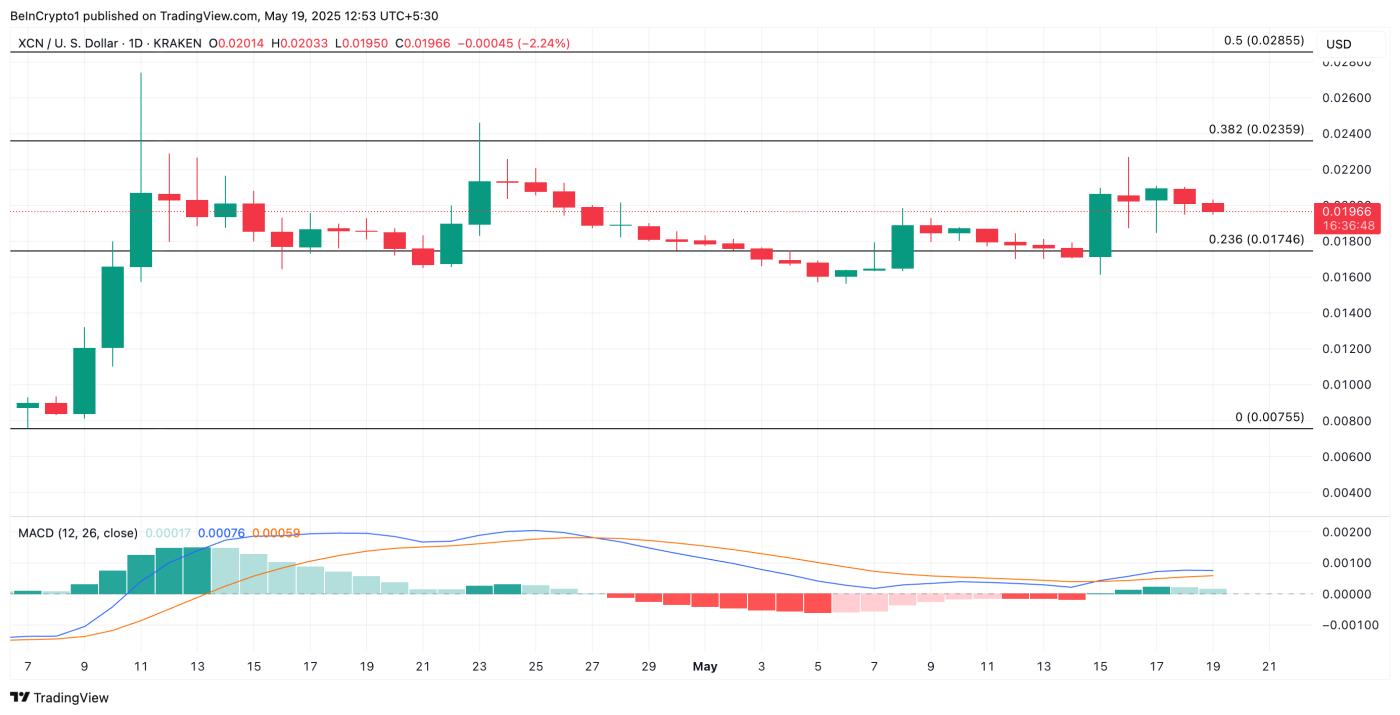 XCN price analysis. Source: TradingView
However, XCN might lose some recent profits if profit-taking activity begins and drops to 0.0174 USD.
Bitget Token (BGB)BGB is the second cryptocurrency winner last week. Its price increased by 3% and is currently trading at 5.17 USD. Its rising Chaikin Money Flow (CMF) index reflects increasing buying pressure among market participants. At the time of writing, this index is 0.23.
CMF measures how money flows in and out of an asset. A positive CMF index like this indicates buying pressure outweighs selling pressure, suggesting capital is steadily flowing into the asset.
If this continues, BGB may maintain its price momentum and break through the resistance level at 5.31 USD. If successful, the token could extend profits to 6.08 USD.
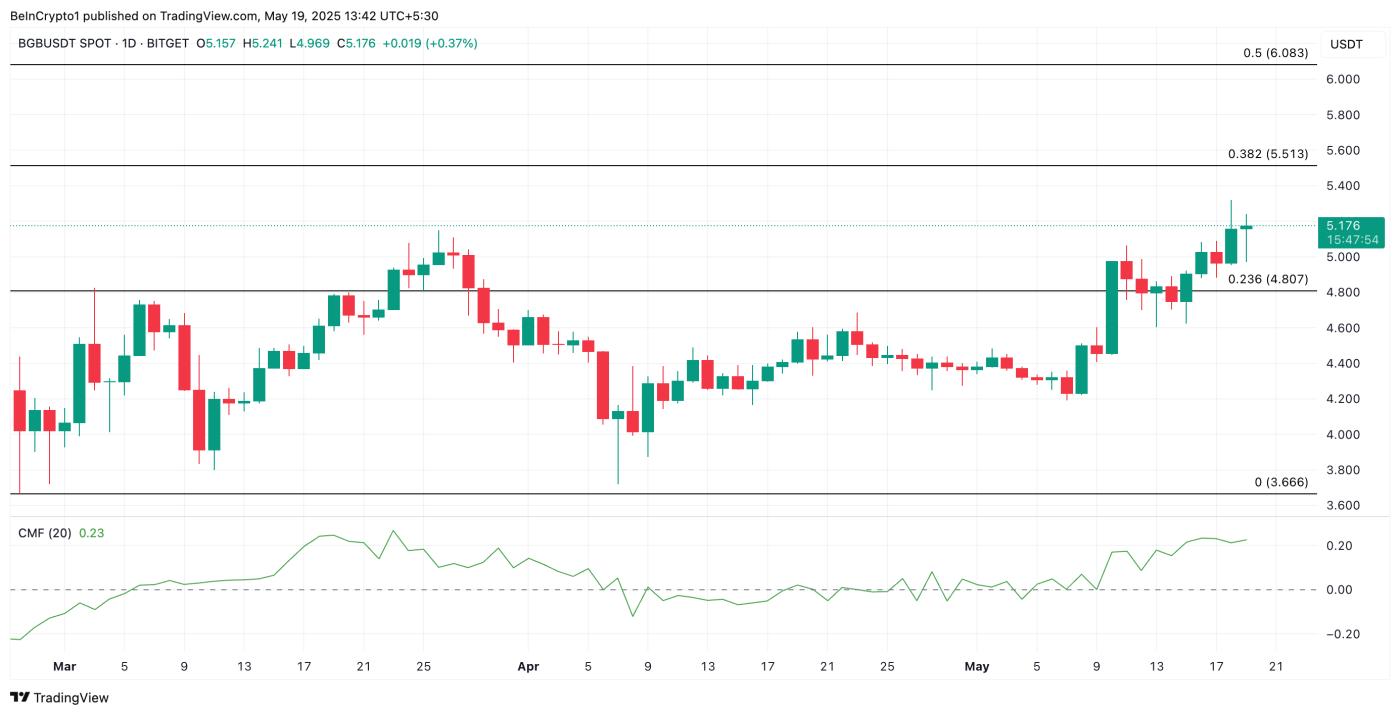 BGB price analysis. Source: TradingView
Conversely, if selling activity begins, BGB could drop to 4.80 USD.
Top Cryptocurrency Losers
Bonk and TIA led cryptocurrency market losses last week, performing poorly in a primarily sideways trading environment. Both tokens faced increasing selling pressure and declining momentum.
Bonk (BONK)The Solana-based meme coin, BONK, was one of the biggest losers last week. The token's price dropped 22% during that period and is currently trading at 0.000019 USD.
Negative indicators from this meme coin include the Balance of Power (BoP), reflecting weakening demand among market participants. The momentum indicator is trending downward at -0.67 at the time of writing.
The BoP indicator measures buyer strength versus sellers by comparing closing prices with the trading range in a specific time period. When its value is negative, it indicates sellers are in control and downward price pressure is overwhelming buying interest.
If selling activity intensifies, it could push BONK's price down to 0.000016 USD.
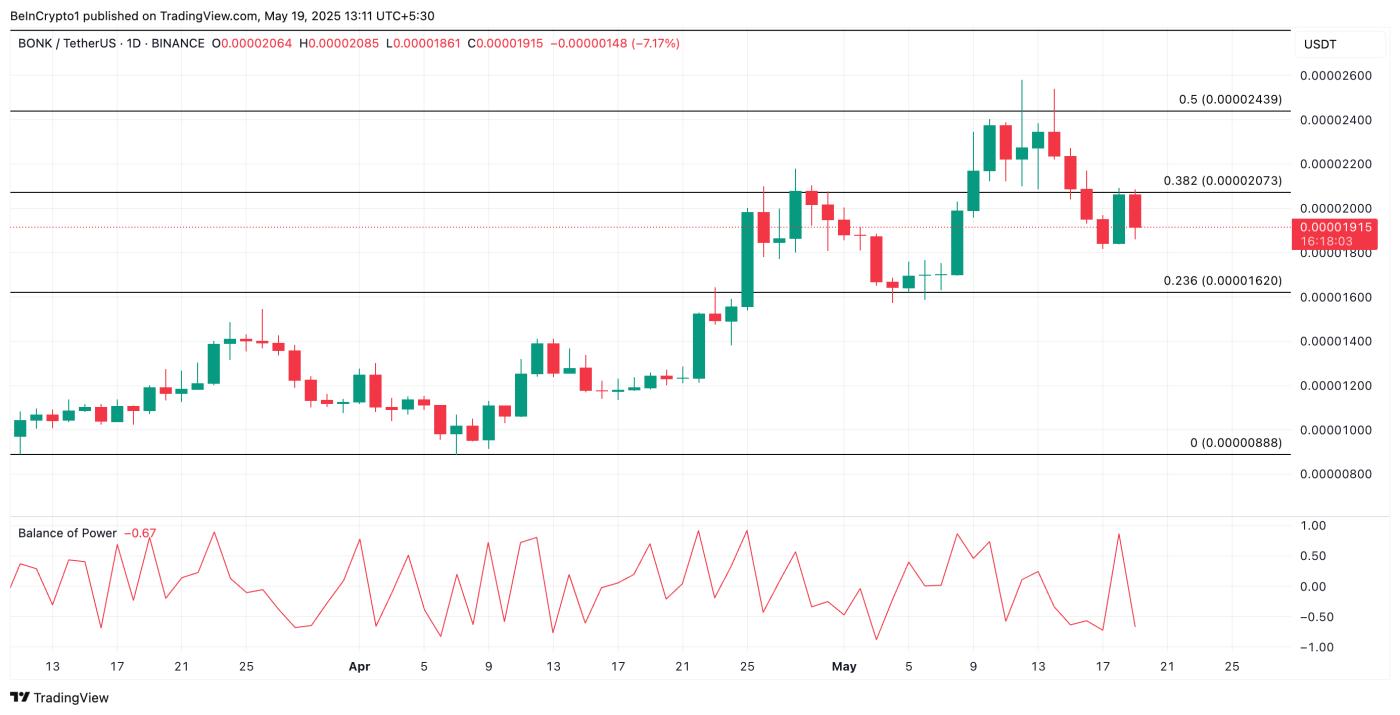 BONK price analysis. Source: TradingView
Conversely, if new demand emerges for this meme coin, it would invalidate this downward prospect. In that case, BONK's value could rise to 0.000020 USD and attempt to break above this level.
Celestia (TIA)TIA dropped 23% over the past week, making it one of the most significant declines in the market. The altcoin is currently trading at 2.56 USD, falling an additional 3% today as it follows the broader market's downward trend.
During this period, the token's trading volume increased by nearly 80% to reach 128 million USD. This creates a negative divergence, suggesting a potential further price decline.
When an asset's price drops while trading volume increases, it signals strong selling pressure. This trend indicates growing downward momentum among TIA investors as traders exit their trading positions.
If this continues, TIA could drop to 2.14 USD.
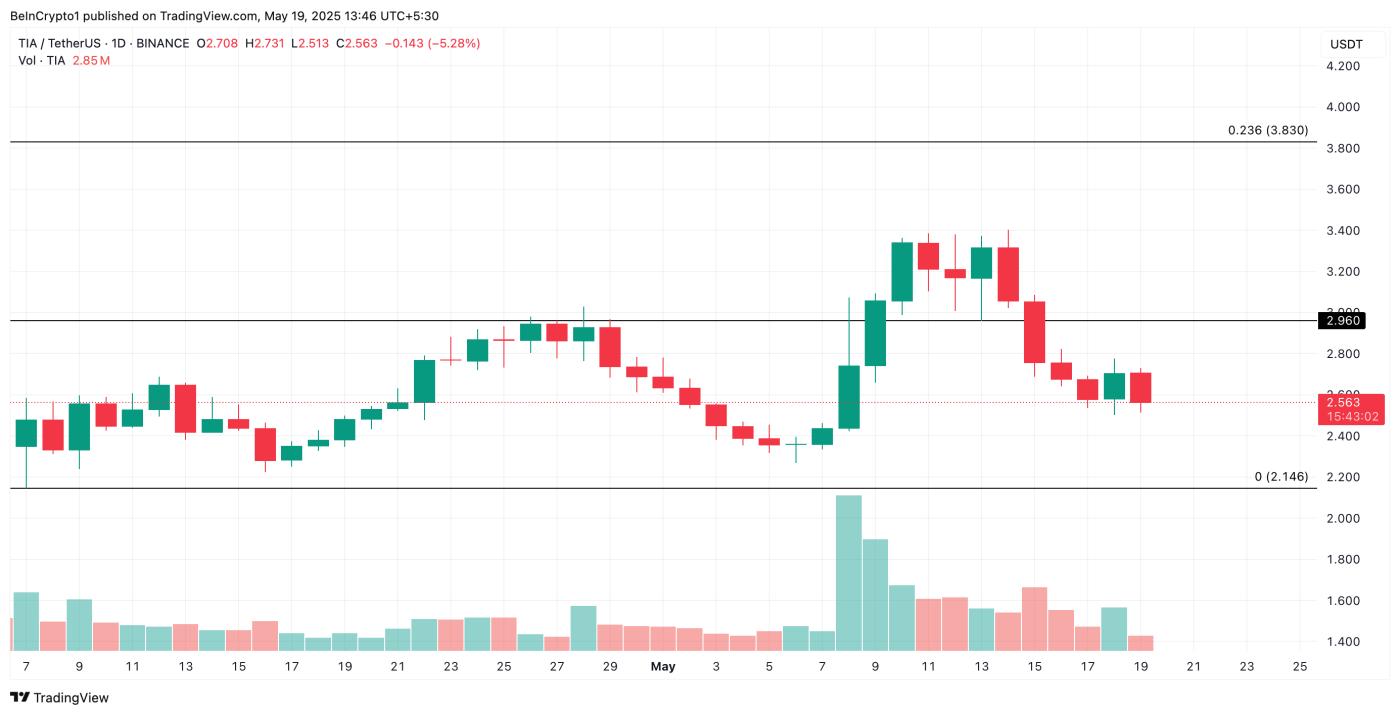 TIA price analysis. Source: TradingView
Conversely, if demand strengthens significantly, the token's price could climb to 2.96 USD.


