

BNB is showing strong momentum in both its ecosystem and technical indicators. Its DEX volume has increased by 85% in the past week, outperforming chains like Ethereum and Solana.
Technically, BNB is supported by rising EMA arrangement, strong DMI index, and favorable Ichimoku Cloud signal—all indicating an active upward trend. Although there might be a short-term adjustment, current indicators suggest the trend still leans towards price increase.
BNB DEX Volume Increases 85%, Surpassing Ethereum, Solana, and Arbitrum
The DEX ecosystem of the BNB chain is demonstrating superior strength, with decentralized exchange trading volume increasing over 85% in the past seven days, reaching $34.85 billion.
In contrast, all other top chains—Solana, Ethereum, Base, and Arbitrum—have seen DEX volume decrease by at least 13% during the same period.
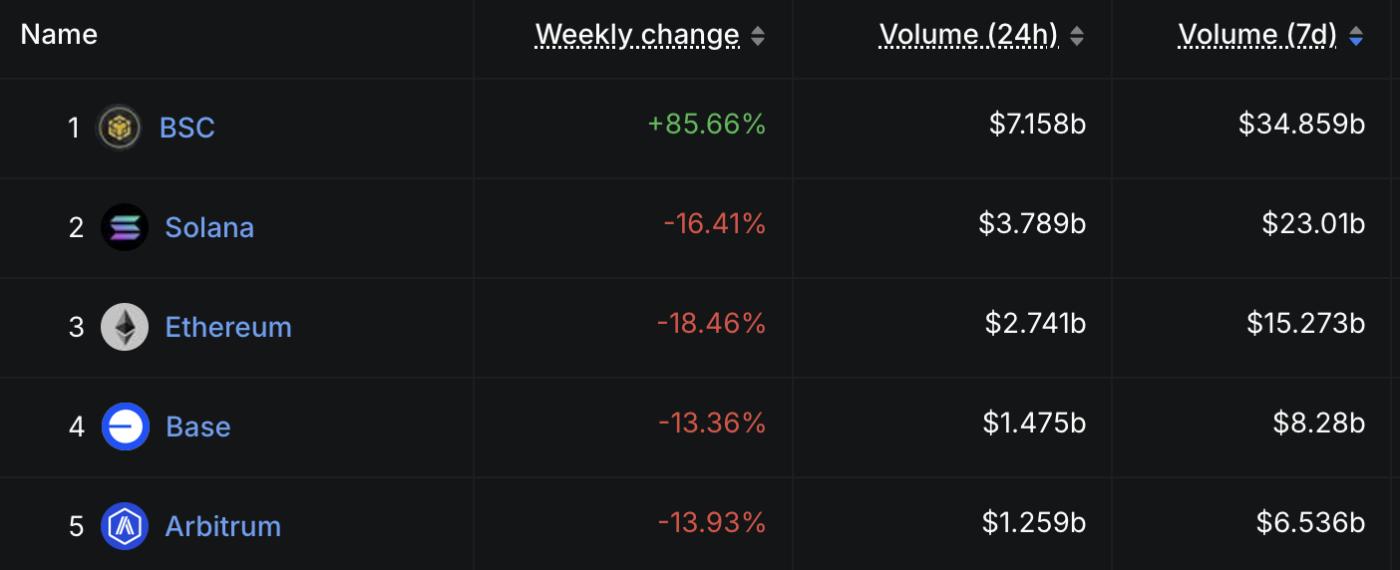 Top Chains by DEX Volume. Source: defillama.
BNB recorded $7.15 billion in DEX volume in the past 24 hours. This shows clear momentum compared to competitors. PancakeSwap leads activity, processing $8.7 billion in daily volume and $30.84 billion in the past week.
That weekly total is higher than the combined volume of Solana's four top DEXs—Orca, Meteora, Raydium, and Pump. This emphasizes BNB's growing dominance in DeFi.
BNB Enters Strong Trend Zone with Rising DMI and Ichimoku Synchronization
BNB's Directional Movement Index (DMI) is signaling a strong trend, with the current ADX at 33.48—a significant increase from 13 just two days ago.
ADX (Average Directional Index) measures trend strength, regardless of direction. Values below 20 indicate weak conditions or no trend, while readings above 25–30 confirm an ongoing strong trend.
BNB's surge above 30 indicates the asset has entered a high momentum phase, with traders paying attention to directional indicators for confirmation.
+DI, tracking price increase pressure, is currently at 33.97—rising from 21.3 two days ago but slightly decreasing from 42.41 yesterday. This suggests buyers remain dominant, although momentum might be slightly declining.
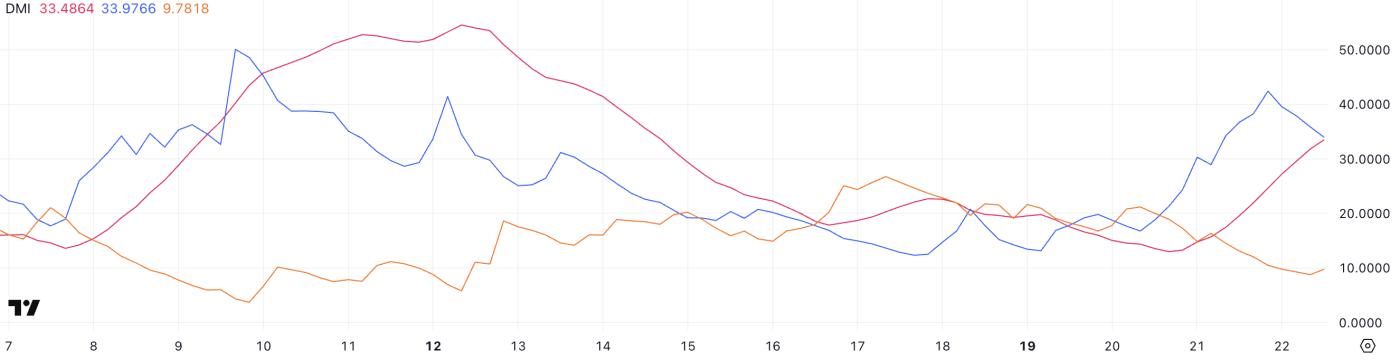 BNB DMI. Source: TradingView.
Meanwhile, -DI, reflecting price decrease pressure, has dropped to 9.78 from 16.36, reinforcing the price increase trend.
This structure—rising ADX, strong +DI, and decreasing -DI—typically signals a sustainable upward trend, although the slight decrease in +DI suggests BNB might face some short-term adjustments before continuing higher.
The Ichimoku Cloud chart for BNB shows a strong price increase structure. Price action clearly sits above the cloud (Kumo), indicating an overall upward trend.
The forward cloud is thin and beginning to turn green, suggesting price increase momentum may continue, though the narrow distance indicates the trend is not yet too strong.
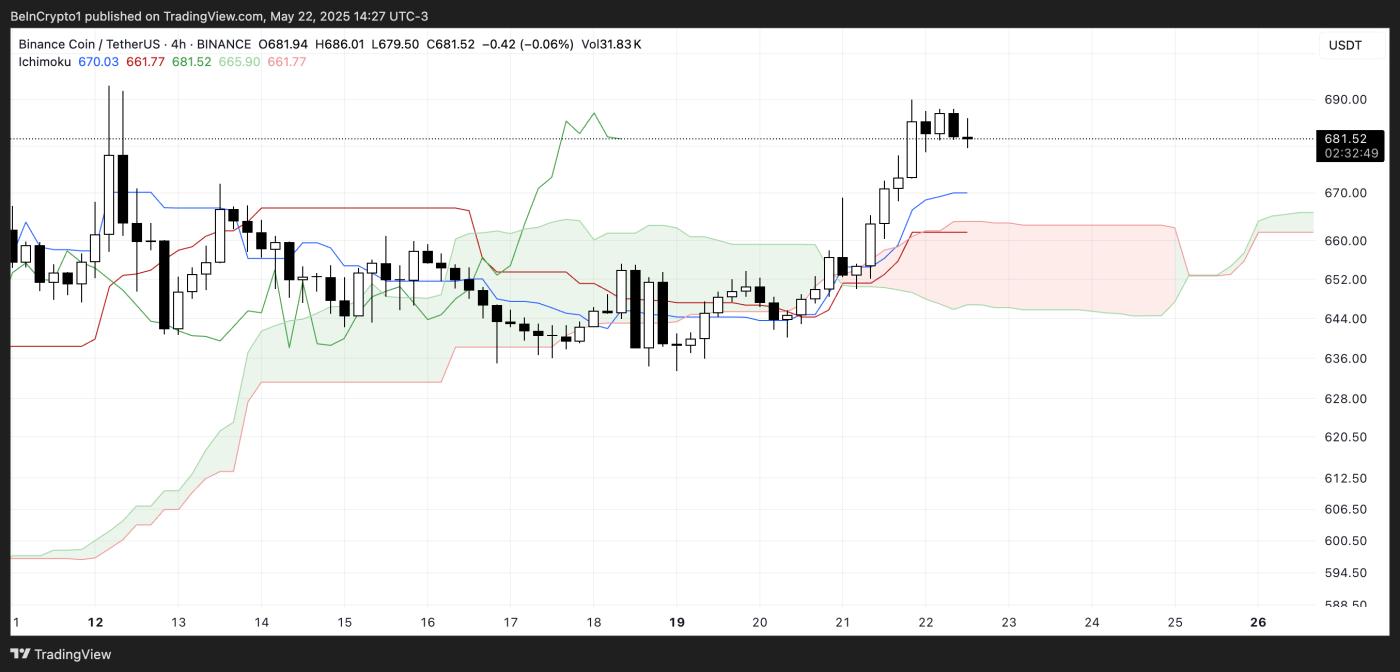 BNB Ichimoku Cloud. Source: TradingView.
The green line (Tenkan-sen) is above the red line (Kijun-sen), a classic price increase crossover reflecting short-term strength. Both lines are rising and sit below current price, providing short-term support.
Additionally, the green Lagging Span line (Chikou Span) sits above both price and cloud, confirming current trend strength from a historical perspective.
The chart reflects a price increase structure, but the sideways movement in recent candles suggests potential for short-term adjustment.
BNB Maintains Rising EMA Structure as Upward Trend Remains Steady
BNB's EMA structure continues to maintain a strong upward trend, with short-term moving averages sitting above long-term averages—indicating sustainable increase momentum.
The token has increased 12% in the past 30 days and 2.5% in the past 24 hours, reflecting stable market confidence.
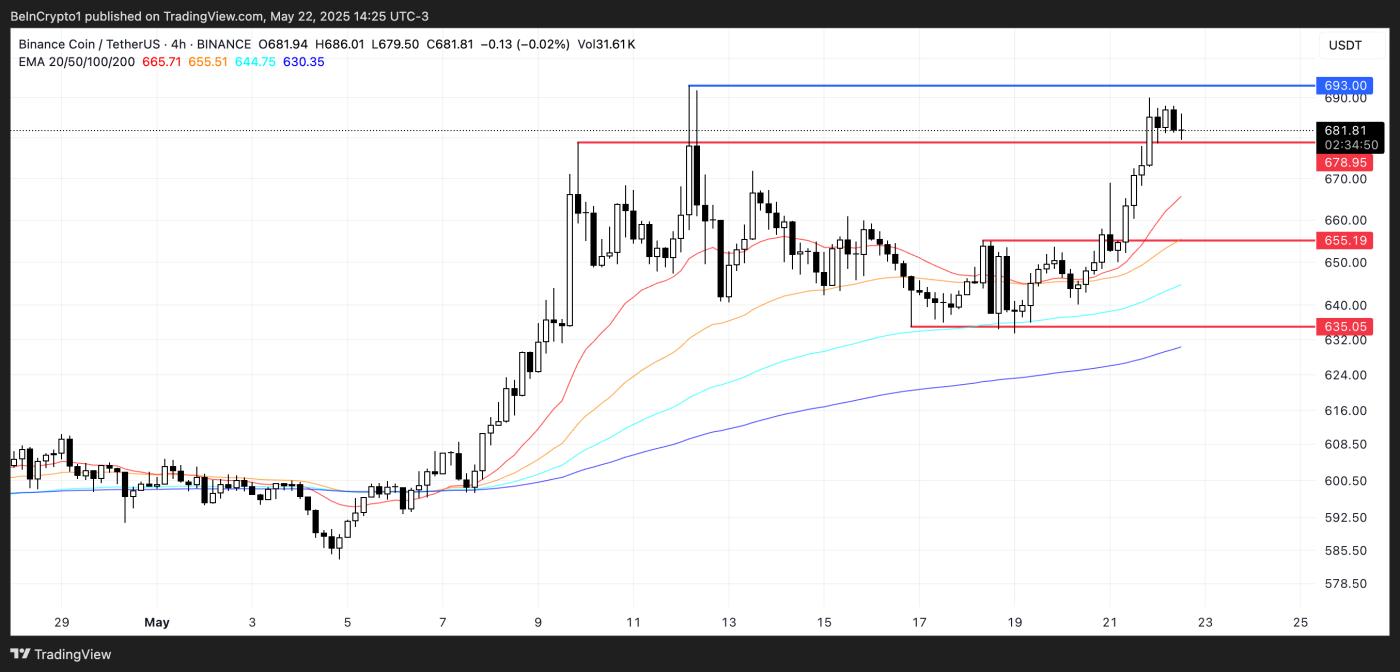 BNB Price Analysis. Source: TradingView.
This EMA arrangement typically signals strong trend continuation, especially when supported by price action and increasing volume.
If the current upward trend is maintained, BNB might push higher to challenge the next resistance level. However, caution is advised: downward pressure could increase if the $678 support is broken, potentially pulling the price down to $655 or even $635 in a more extended adjustment.


