

Aave (AAVE) is showing new strength in the market, increasing 15% in the past 24 hours and nearly 40% in the past 30 days. Its market capital is currently at $4.6 billion. This growth has brought AAVE back to the center of DeFi leaders, supported by positive technical indicators.
This altcoin has entered the overbought zone, and CMF shows strong capital flow. As AAVE approaches important resistance zones, traders are closely monitoring for potential breakouts or reversal signs.
RSI Touches Overbought Zone: What Happens Next?
Aave's Relative Strength Index (RSI) is currently at 75.83, having strongly increased from 44.51 two days ago. It has maintained above 70 since yesterday, firmly in the "overbought" zone.
This rapid increase reflects strong buying momentum and indicates increased market interest in AAVE.
This move follows the increased activity of DeFi tokens, aligning with the increase in trading volume and price action across the industry.
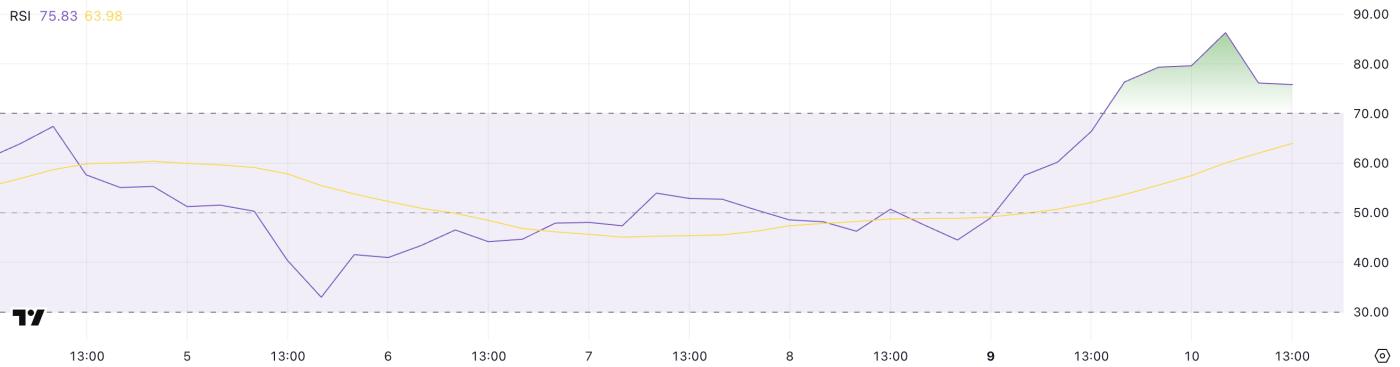 AAVE RSI. Source: TradingView.
RSI is a technical indicator measuring the speed and recent price change rate to assess whether an asset is overbought or oversold.
RSI above 70 typically signals that a token may be overbought and likely needs adjustment or consolidation. Meanwhile, RSI below 30 indicates oversold conditions that could lead to recovery.
With AAVE's RSI at 75.83, traders may start predicting short-term resistance or cooling off.
However, strong RSI indicators in an uptrend can signal strength, meaning AAVE might continue rising higher if momentum remains intact.
Increasing Capital Inflow Signals Accumulation
Aave's Chaikin Money Flow (CMF) is currently at 0.24, increasing from -0.04 two days ago, though declining from the peak of 0.41 just a few hours earlier.
This transition to a positive zone reflects recent buying pressure and capital inflow into AAVE, despite a slight daily adjustment.
The overall trend shows increasing demand, with buyers participating more strongly compared to the beginning of the week.
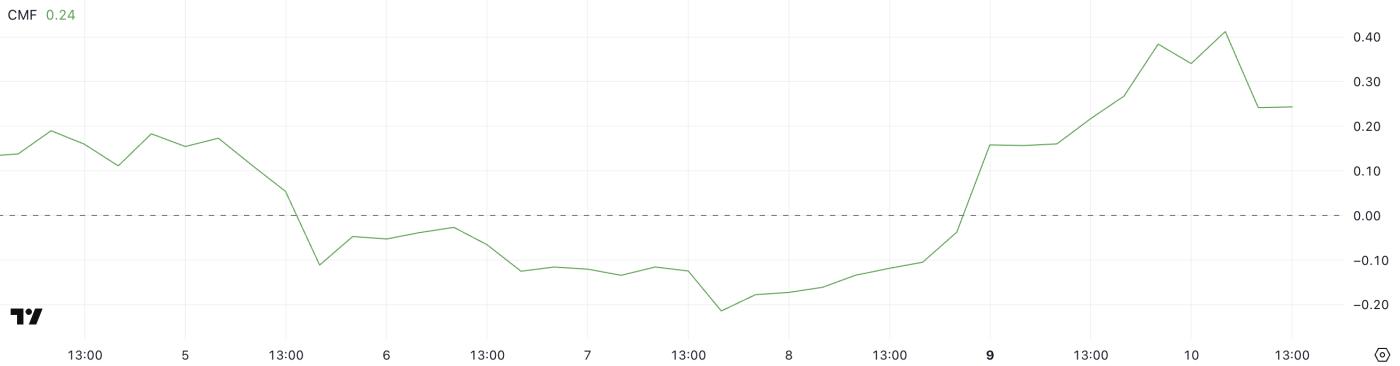 AAVE CMF. Source: TradingView.
CMF is a volume-weighted indicator measuring capital inflow and outflow from an asset over a specific period. It typically oscillates from -1 to +1, where values above 0 indicate buying pressure (accumulation) and below 0 indicate selling pressure (distribution).
With CMF at 0.24, data shows sustainable accumulation, though the decline from 0.41 suggests some buyers might be taking profits or momentum might be slightly cooling.
If CMF remains positive, AAVE might continue experiencing upward price pressure in the short term.
AAVE's EMA Signals Price Strength — But Pay Attention to These Important Levels
AAVE's EMA lines currently show a strong upward trend. Short-term medium lines are above long-term lines, with a significant distance between them, typically a sign of sustainable upward momentum.
This trend structure reflects a healthy trend and supports the potential for further price increases.
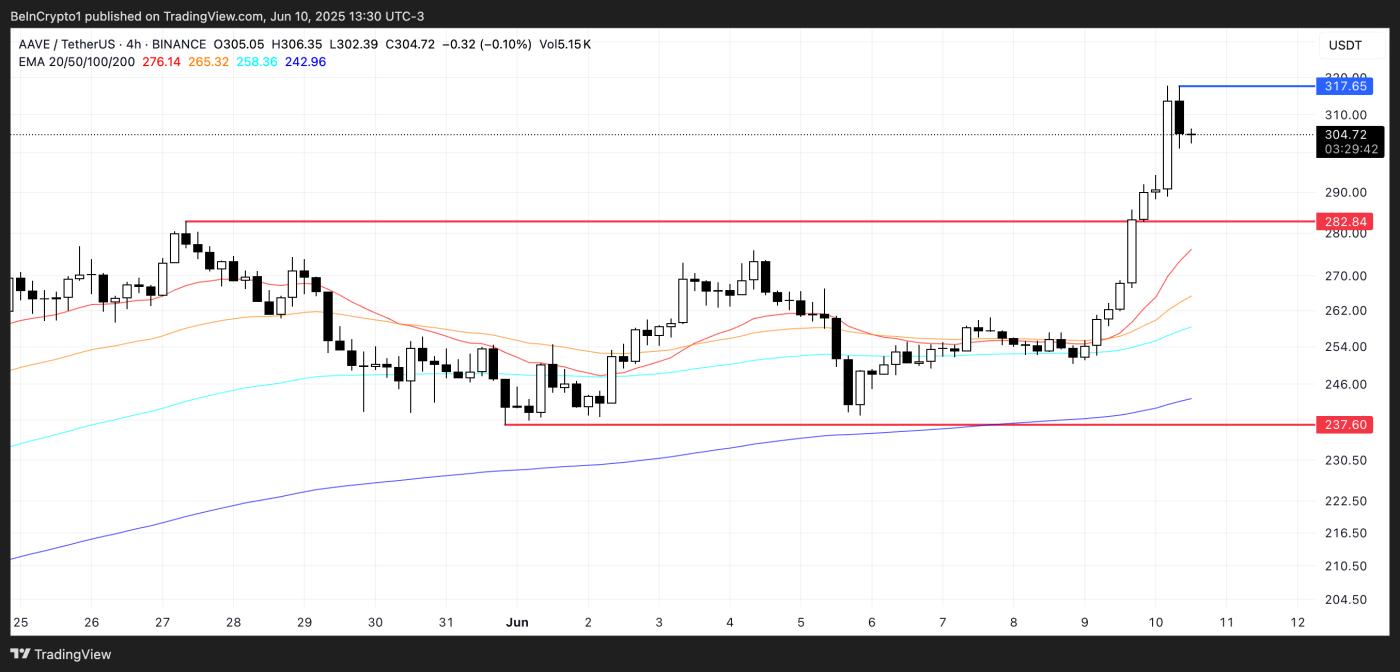 AAVE Price Analysis. Source: TradingView.
If AAVE's price can break through the current resistance level at $317, the next price target could be above $340, as traders follow the momentum and breakout buyers join in.
However, if rejected at the $317 resistance level or experiencing a broader market adjustment, the lower support level at $282 might be considered.
If that level doesn't hold, the price could return to around $237, marking a significant reversal from current levels.


