

Hedera (HBAR) is under heavy pressure, dropping 5% in the past 24 hours and over 25% in the past 30 days. This sharp decline has pushed many technical indicators into negative territory, raising concerns about a potential collapse.
Momentum has significantly weakened, with BBTrend and RSI showing declining strength and increasing selling pressure. All attention is now focused on the critical support level of $0.153, which could determine whether HBAR will recover or slide further to new lows.
HBAR Struggles to Regain Momentum
Hedera's BBTrend is currently at -1.2, recovering from -3.27 earlier today but still below the 2.63 seen two days ago.
This decline suggests that upward price momentum is fading after a short-term surge. HBAR may be transitioning from a breakout effort to a consolidation phase.
A quick recovery from deeper negative levels indicates buying support, but the overall trend remains weak.
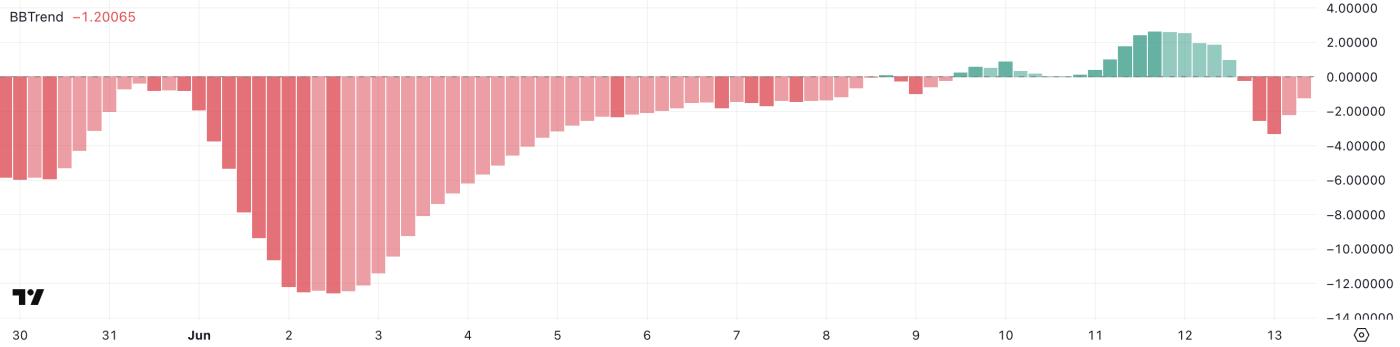 HBAR BBTrend. Source: TradingView.
BBTrend, or Bollinger Band Trend, measures the strength and volatility of price movements relative to Bollinger Bands.
Values above +1 typically indicate strong upward momentum, while values below -1 show downward price pressure. With HBAR's BBTrend at -1.2, the signal leans towards price decline, but not extremely deep—suggesting that while selling pressure remains dominant, it may be losing intensity.
If BBTrend moves towards neutral or turns positive, it could signal a recovery or new buying interest.
HBAR's RSI Drops Below 30: Oversold Signal Indicates Potential Recovery
Hedera's RSI has sharply dropped to 22.29, from 61.99 just two days ago. This indicates rapidly increasing selling pressure.
This decline pushes HBAR into a deep oversold zone, signaling a strong correction. While it may reflect panic selling, it could also open up recovery opportunities if buyers step in.
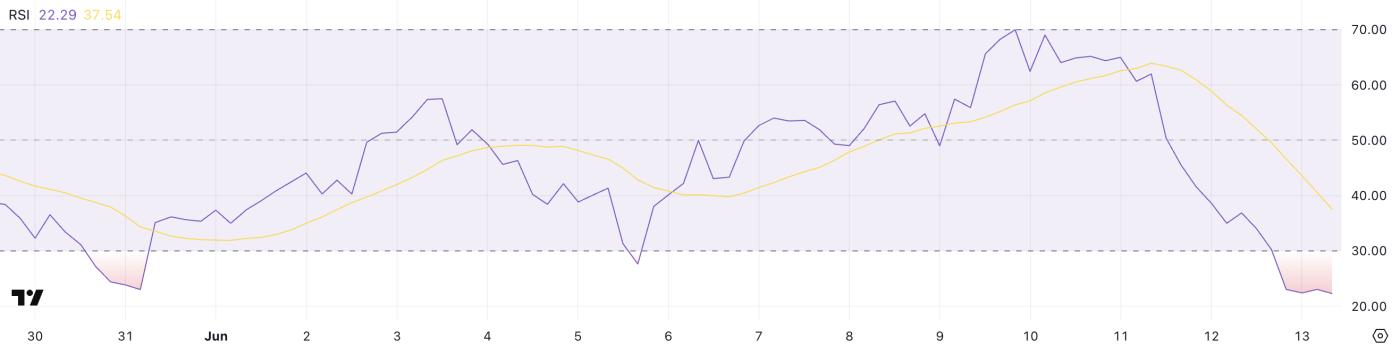 HBAR RSI. Source: TradingView.
RSI is a momentum indicator tracking the speed and magnitude of price changes on a scale from 0 to 100. Values above 70 typically mean an asset is overbought, while values below 30 indicate it is oversold.
HBAR's current RSI of 22.29 places it in the oversold zone. If the critical support level holds, this could limit further decline and signal a potential recovery.
Hedera Faces Decline Risk at $0.153
Hedera's price is currently hovering just above the critical support level at $0.153, an area that has held firm during previous declines.
However, if this support level is tested and fails, Hedera could drop to the next key support around $0.124.
Adding to the negative outlook, HBAR's EMA lines recently formed a "death cross"—a technical signal typically indicating downward momentum and potential further losses.
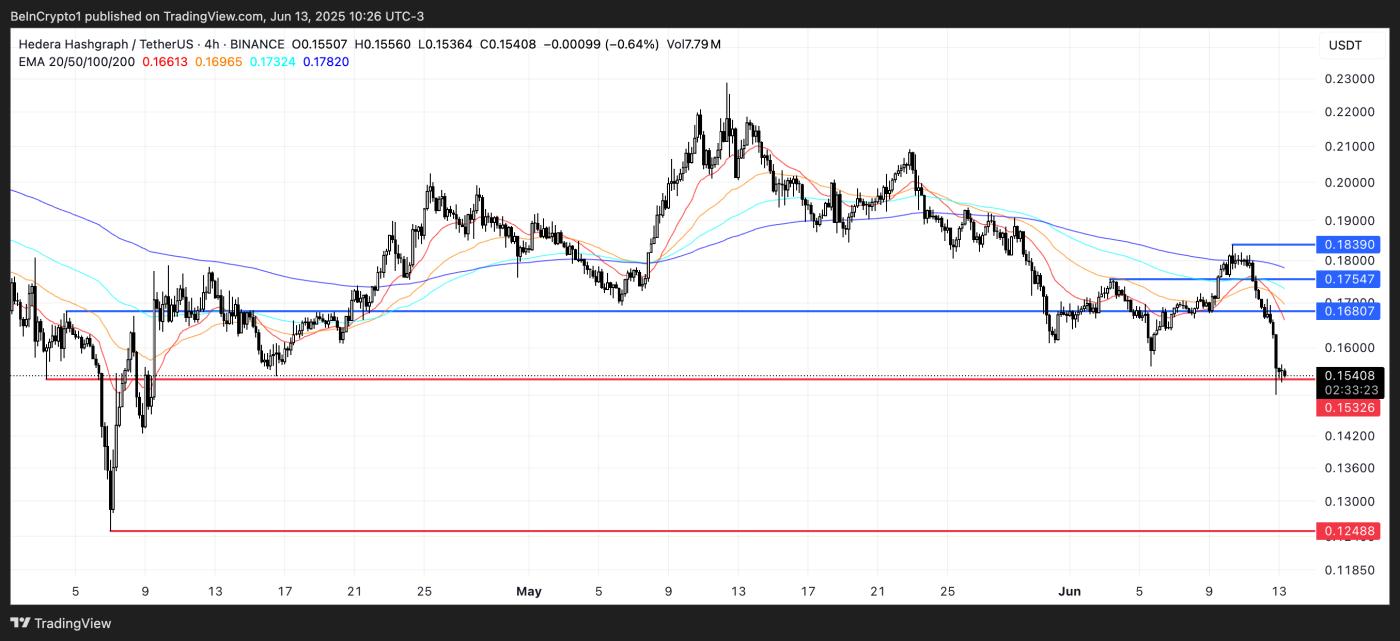 HBAR Price Analysis. Source: TradingView.
However, a reversal in momentum could quickly change the outlook. If buyers regain control and push HBAR above the immediate resistance at $0.168, the token could test higher levels at $0.175 and even $0.183 if the uptrend accelerates quickly.
These resistance areas have been turning points and would require strong volume to break decisively.
Whether HBAR will collapse or recover will depend on its performance around the $0.153 level in the coming sessions.


