

The supply growth of USDC is gradually shifting from Ethereum-centric to a broader ecosystem, including Solana, Ethereum Layer 2, and emerging Alt-VM chains.
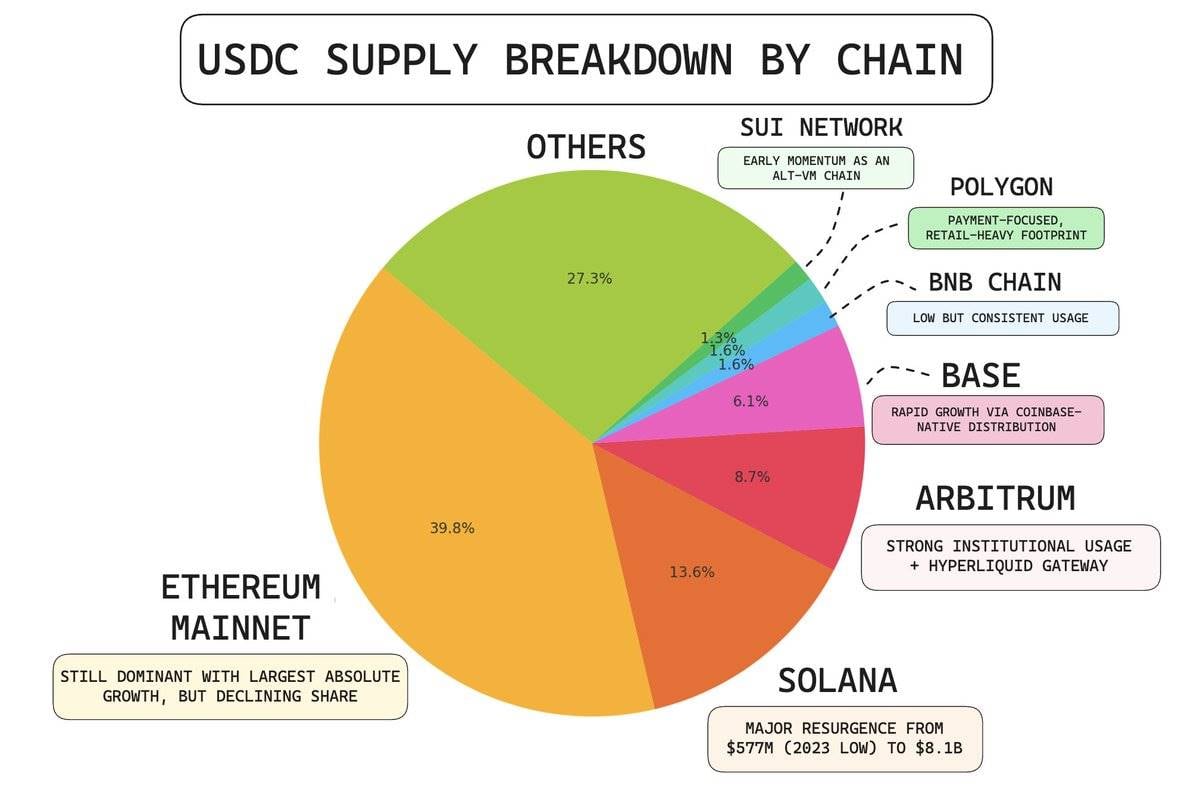
Current Circle USDC Supply Details - Source: Artemisxyz
Data shows that USDC's supply is increasingly distributed across a diverse ecosystem, aligning with the fastest-growing areas of liquidity, settlement needs, and on-chain utility.
USDC Dominance on Solana
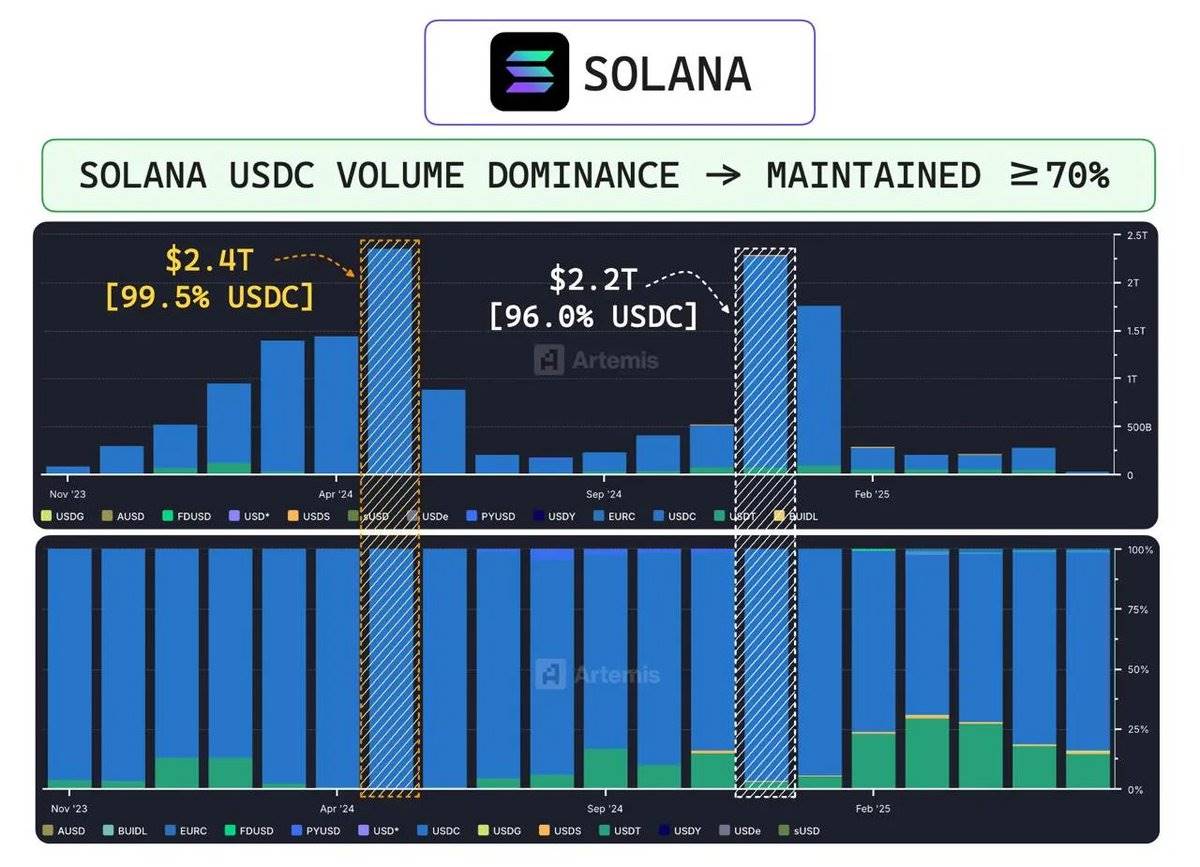
USDC Historical Transaction Volume on Solana Chain - Data Source: Artemisxyz
In May 2024, USDC accounted for 99.5% of stablecoin trading volume on Solana. Even by December, with ecosystem activity becoming more dispersed, USDC maintained a 96% market share.
Arbitrum's Flippening
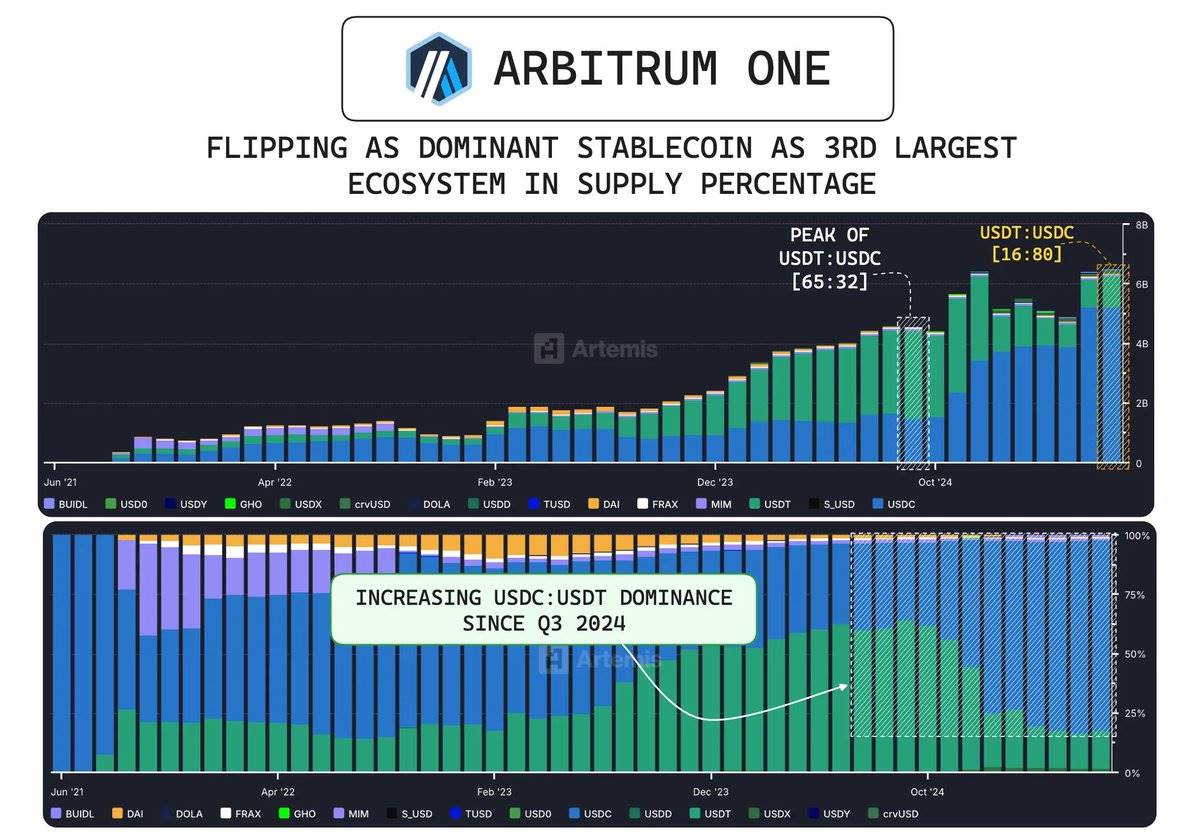
USDC Supply Changes on ArbitrumOne - Data Source: Artemisxyz
In September 2024, USDC quietly surpassed USDT on Arbitrum to become the dominant stablecoin. At its peak, the supply ratio of USDT to USDC was 2.03 (Tether's supply was more than twice that of USDC). Now, this ratio has dropped to 0.2.
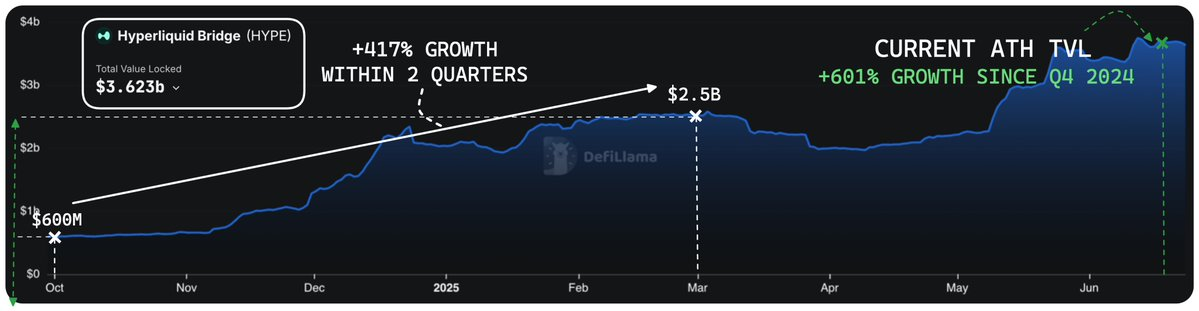
Hyperliquid Bridge Momentum - Data Source: defillama
This reversal is primarily due to Hyperliquid's explosive growth, with its Total Value Locked (TVL) soaring from $600 million in Q4 2024 to $2.5 billion by the end of Q1 2025, an increase of 417%. To date, Hyperliquid's bridge deposits have reached a historic high of $3.62 billion, growing 601% from the Q4 base.
This change reflects the unique structural alignment between Arbitrum's core ecosystem and its extended integrations, creating conditions for stablecoin dominance.
USDC Supply Curve Quantification Model: Capturing Stablecoin Supply Dynamics
Given the importance of USDC supply dynamics, we constructed an autoregressive model (AR model) to predict total USDC supply. We chose the AR model for its simplicity, transparency, and good performance in the local linear growth pattern of the USDC supply curve.
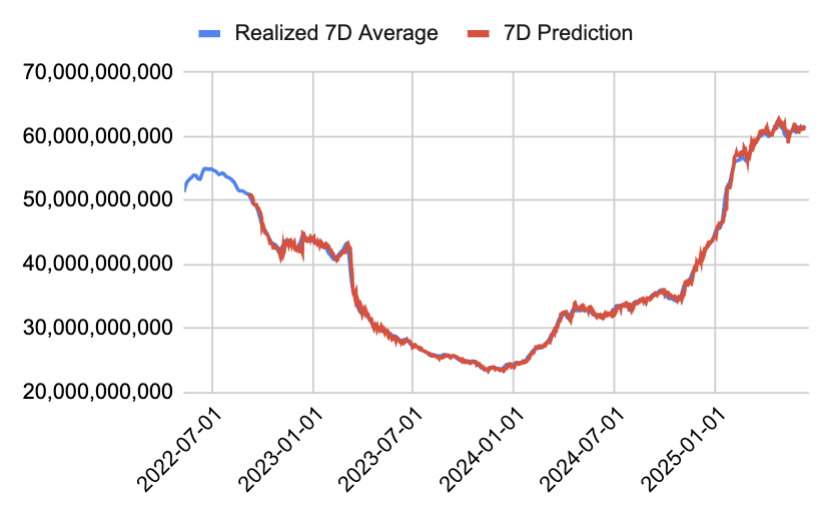
Data Source: Internal Model
The model is recalibrated every 90 days to capture the latest market trends while ensuring a sufficiently robust sample size for regression and matrix calculations. Each prediction cycle has a dedicated model, trained on a 90-day sliding window (7 independent regression models, each with a unique set of beta coefficients). The model uses moving averages (1-day, 3-day, 7-day, 14-day, and 30-day) as feature variables, predicting the future n-day average of USDC supply, where n ranges from 1 to 7. The regression constant is set to zero to ensure the model relies entirely on signal-driven inputs.
This approach is highly effective in predicting short-term directional changes in supply. Since 2022, the model's predicted 7-day average total USDC supply has an 80% probability of falling within ±1.5% of the predicted result.
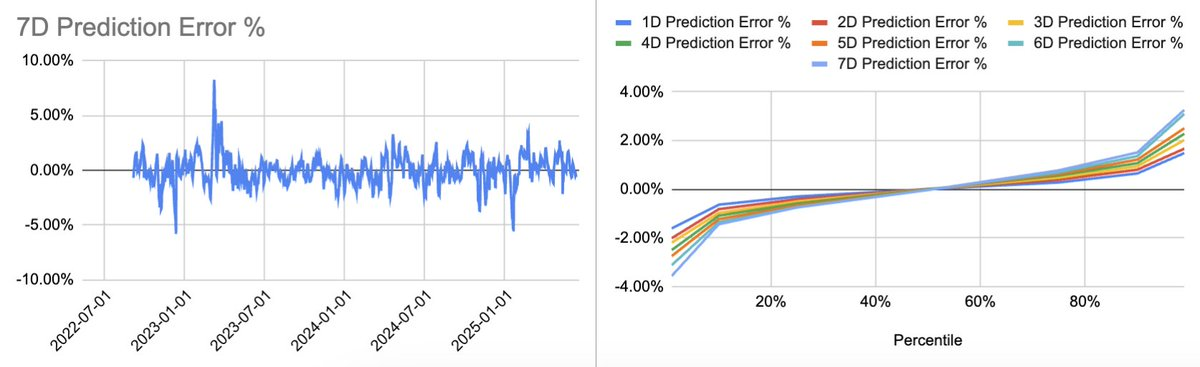
Data Source: Internal Model
Conclusion
Circle's listing marks a significant turning point in the crypto industry. It is more than just a capital raise; it demonstrates the previously unmet market demand for stablecoins in the public market. Its performance highlights investors' deep interest in compliant digital dollar infrastructure, further solidifying Circle's position as the most explicit public representative of this emerging asset class.
Currently, Circle's valuation has reached $58.2 billion, becoming a gateway for institutions to enter the regulated digital liquidity space, with USDC at the core of this ecosystem. As USDC becomes increasingly embedded in the expanding DeFi ecosystem and traditional financial system, its role is transforming. It is no longer just a reflection of adoption rates but has become a real-time global liquidity barometer, capable of reflecting capital flows, risk sentiment, and market positioning. So far, the only way to bet on this growth is by trading Circle's stock, but stock-specific factors often obscure underlying dynamics.


