

After increasing by over 28% last week, HBAR is now facing a significant resistance level, raising an important question: Can the Bulls maintain this momentum, or is fatigue beginning to set in?
This price surge occurred right after HBAR was added to Grayscale's Smart Contract Fund, a move that sparked optimism and new trading volume. However, HBAR's price is currently hovering around $0.20430, an important technical level related to recent Fibonacci extensions, and momentum seems to be slowing down, at least on the surface.
Bull Strength and Net Inflows Still Support the Upward Trend
However, on-chain indicators tell a more complex story. The Elder-Ray Bull Power index, which measures buyers' strength compared to sellers, has been continuously increasing for four days. This suggests that despite some recent candle wicks (sellers taking profits), the Bulls' confidence remains.
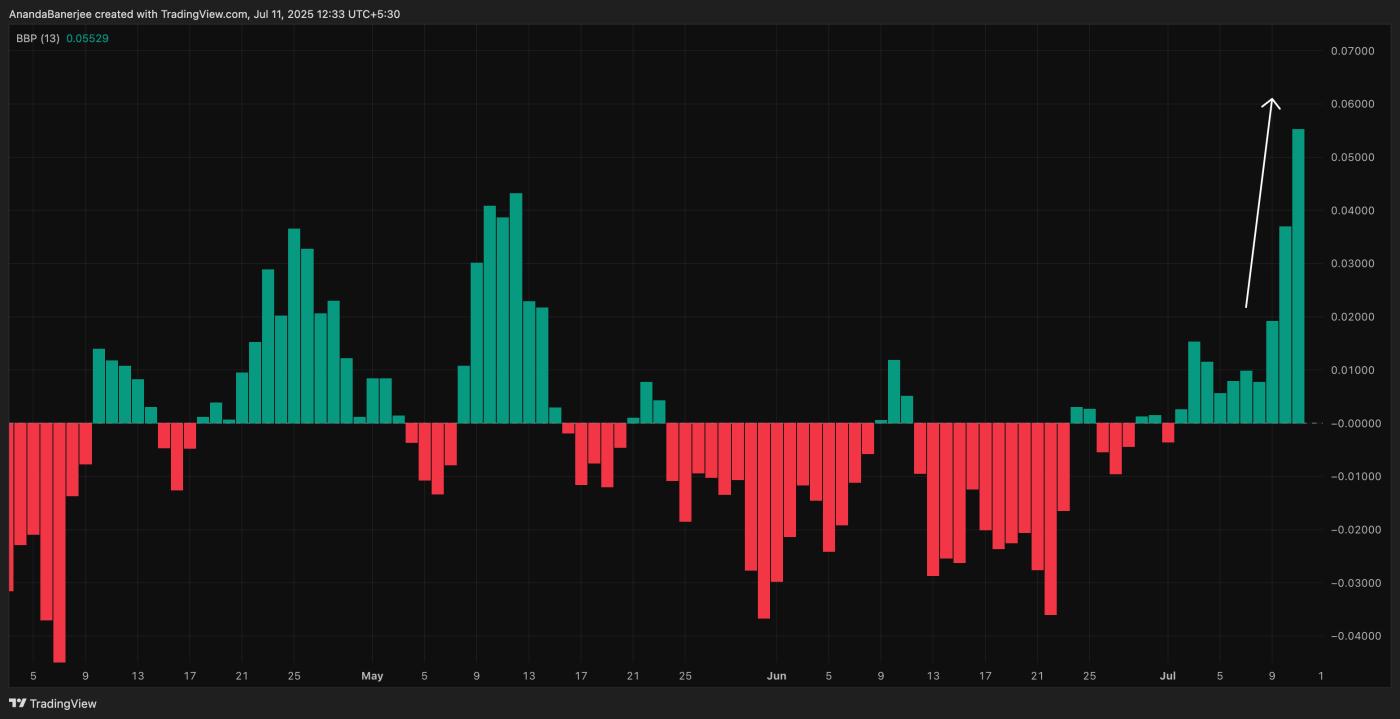 Bulls are currently controlling HBAR's price: TradingView
Meanwhile, net inflows on exchanges confirm a cooling of weekly outflows. While previous price increases were accompanied by strong exits from whales and short-term investors, the pace has now slowed down, typically indicating that fewer traders are rushing to take profits at current levels. This is not an accumulation wave, but it shows that selling pressure is no longer significant.
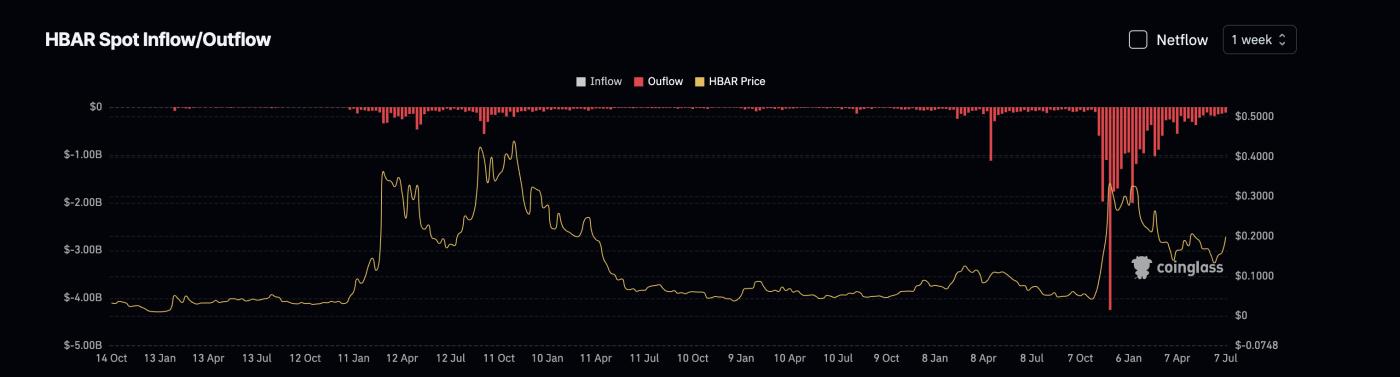 HBAR Price and Outflows: Coinglass
Open Interest Signals Market Confidence
Perhaps the most clear bullish signal comes from Open Interest, which tracks the number of open Futures Contracts. A continuous increase here typically means new money is entering the market, not leaving. Currently, the OI trend suggests traders are still betting on price increases — or at least are not ready to abandon this move.
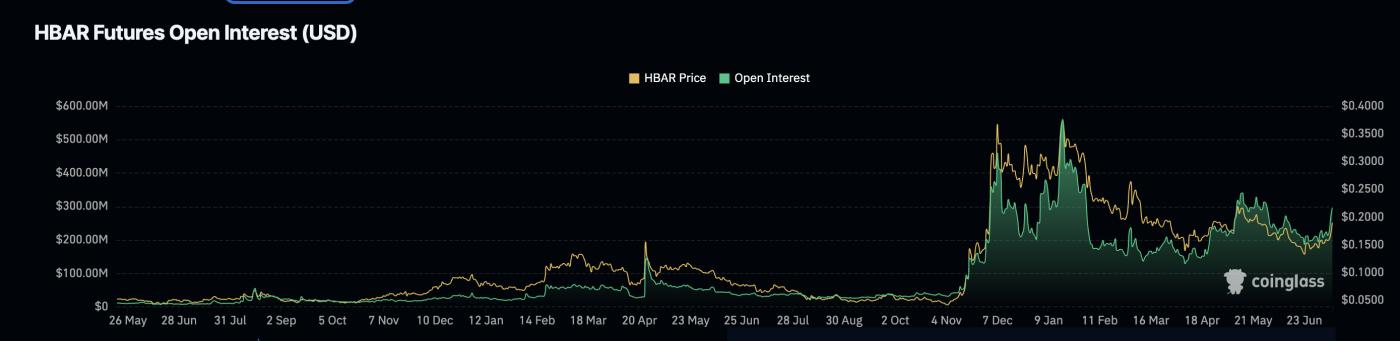 HBAR Price and Open Interest: Coinglass
What is HBAR's Current Price Situation?
This structural context is reinforced by the standard Fibonacci indicator, with levels drawn from the low of $0.12540 to the high of $0.22867. Previous oscillations were used as the newest oscillation is currently developing. The price is currently approaching the 0.618 level at $0.20430; a level HBAR has not recently surpassed.
A move beyond $0.20430 could push HBAR to $0.22867, the previous oscillation high. HBAR is currently trading at $0.19914, close to this important zone.
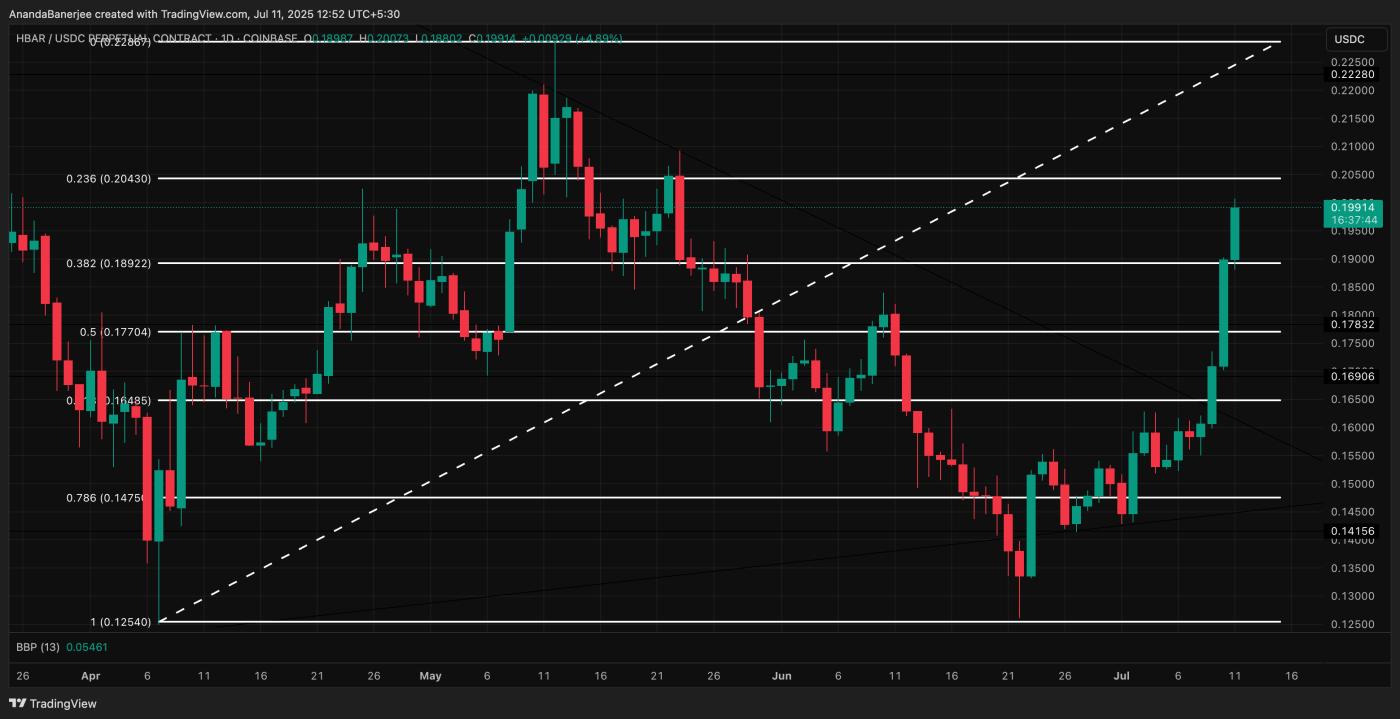 HBAR Price Analysis: TradingView
Zooming in, the daily chart shows a combination of momentum and hesitation. The previous two green candles had strong bodies and minimal wicks, a classic sign of trend strength. But the newest daily candle reveals a long upper wick (forming), suggesting rejection and potential fatigue.
A long wick simply means the Bulls are getting tired!
If this candle closes with a long upper wick, it could mark a short-term local top. If the wick disappears, we can expect the trend to continue.
Failing to close convincingly above $0.20430 will confirm this fatigue and likely push HBAR back to the support zone of $0.17704–$0.16485, invalidating the current upward trend.


