

Hedera (HBAR) just ended July with an 85% increase, marking the strongest monthly performance this year. However, August is not always good for HBAR.
Over the past five years, the token's average profit in August was -3.26%, with a median of only 0.31%, making it one of the weaker months for this asset. The question is whether this August can break the trend or history will repeat itself.
August history suggests a volatile month
Looking back at the monthly profit chart, August only had a strong close in 2021, while most other years ended flat or negative.
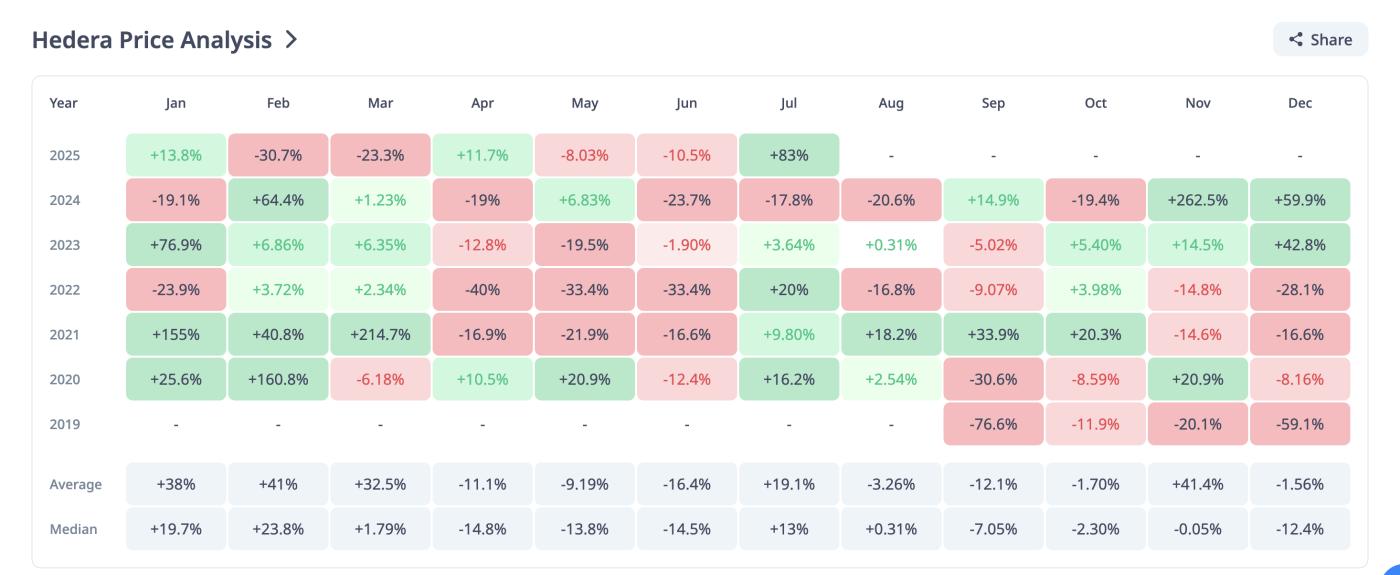 HBAR price performance: CryptoRank
That context creates a cautious sentiment for traders entering this month. Even after July's strong rally, history shows HBAR's price increase could cool down, especially if profit-taking occurs.
Hedera whales continue buying, but growth potential is becoming tight
On-chain data shows large investors with over 1 million HBAR tokens increased their ownership from 64% to 77% in July, while "whales" owning over 10 million tokens reached 96% of total supply.
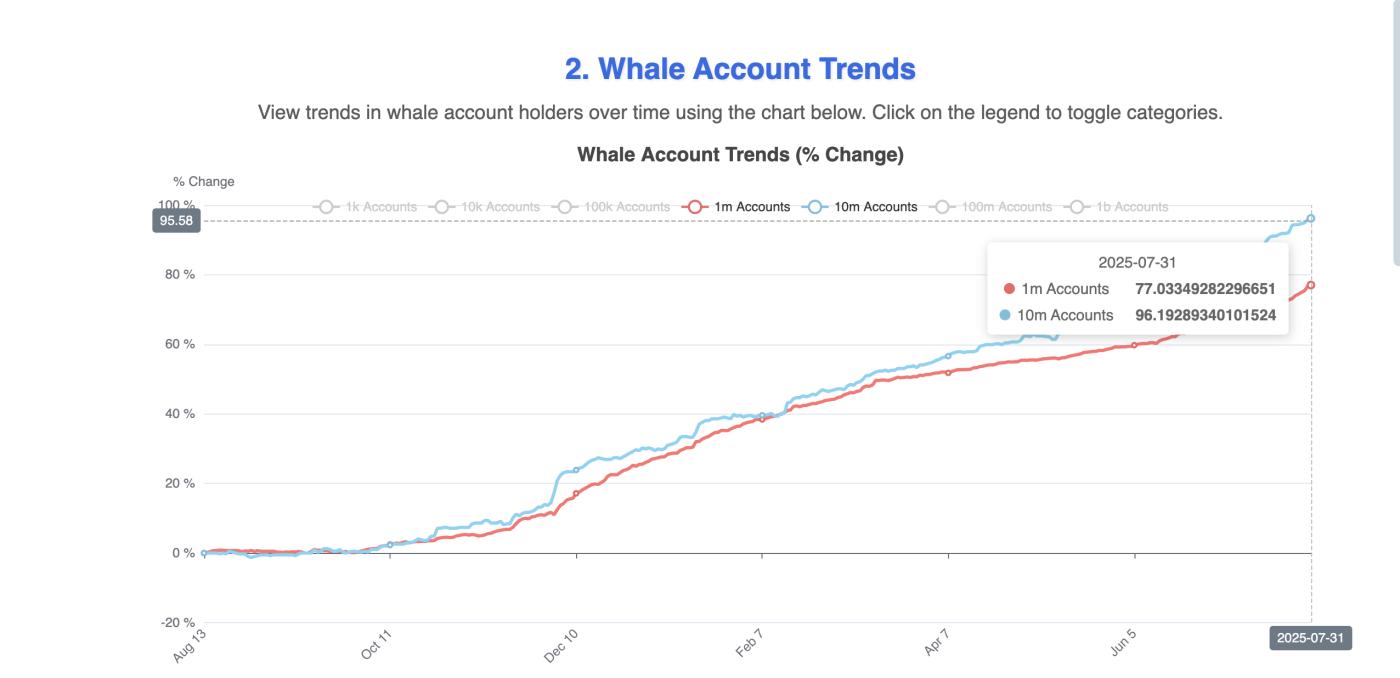 Whale action helped the HBAR price rally in July: Hedera Watch
This steady accumulation was the main driver for July's increase. However, with whales strongly allocated, there might be less new capital to maintain a similar pace in August. Or they might want to re-enter when the price starts to drop!
Any slowdown in whale buying could open an opportunity for a correction.
For TA and token updates: Want more detailed information about tokens like this? Subscribe to the Daily Crypto Newsletter by Editor Harsh Notariya here.
Derivative positions, OBV, and Bull-Bear sentiment are slightly bullish
Bitget's liquidation map shows long leverage far exceeding short leverage (122.75 million USD vs. 49 million USD), meaning the market is still positioned for an upward trend. This skew increases risk: if the price drops, liquidation clusters near 0.2182 USD could accelerate selling.
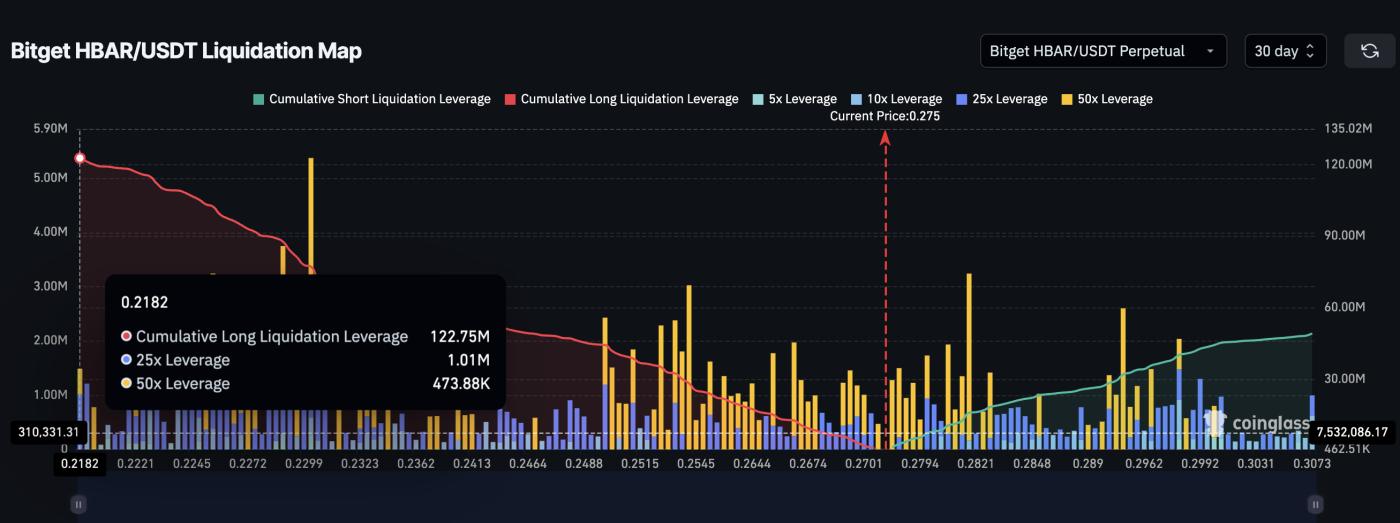 People are betting long on HBAR: Coinglass
Meanwhile, On-Balance Volume (OBV) continues its upward trend, confirming that buying activity still outweighs overall selling activity. However, although OBV is creating higher peaks, it needs to maintain above 41.71 billion to sustain HBAR's price momentum in August.
On-Balance Volume (OBV) is a volume indicator tracking accumulated trading volume to show whether buying or selling pressure is dominant. Rising OBV indicates buyers are in control, while falling OBV signals increasing selling pressure.
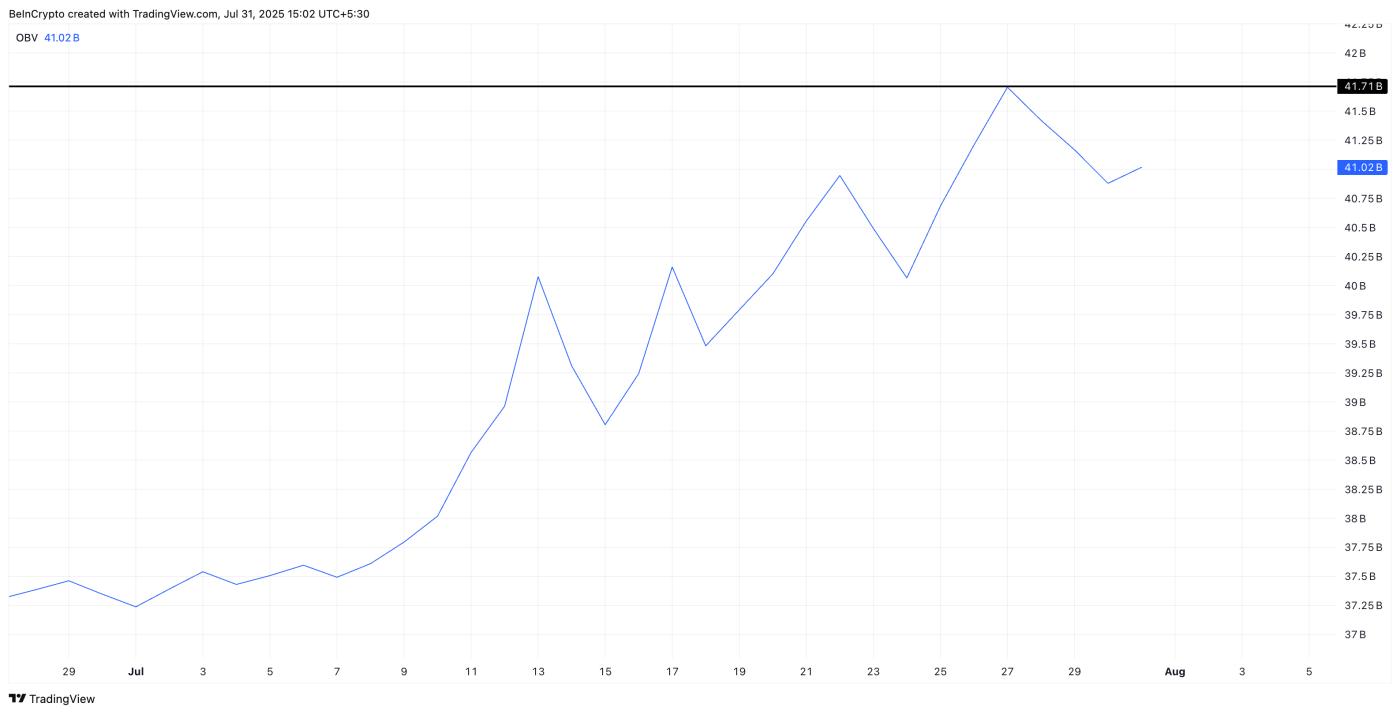 On balance volume supports the rally: TradingView
The Bull-Bear Power (BBP) indicator, which measures whether bulls or bears have stronger momentum, turned negative for a single session last week but quickly turned green again.
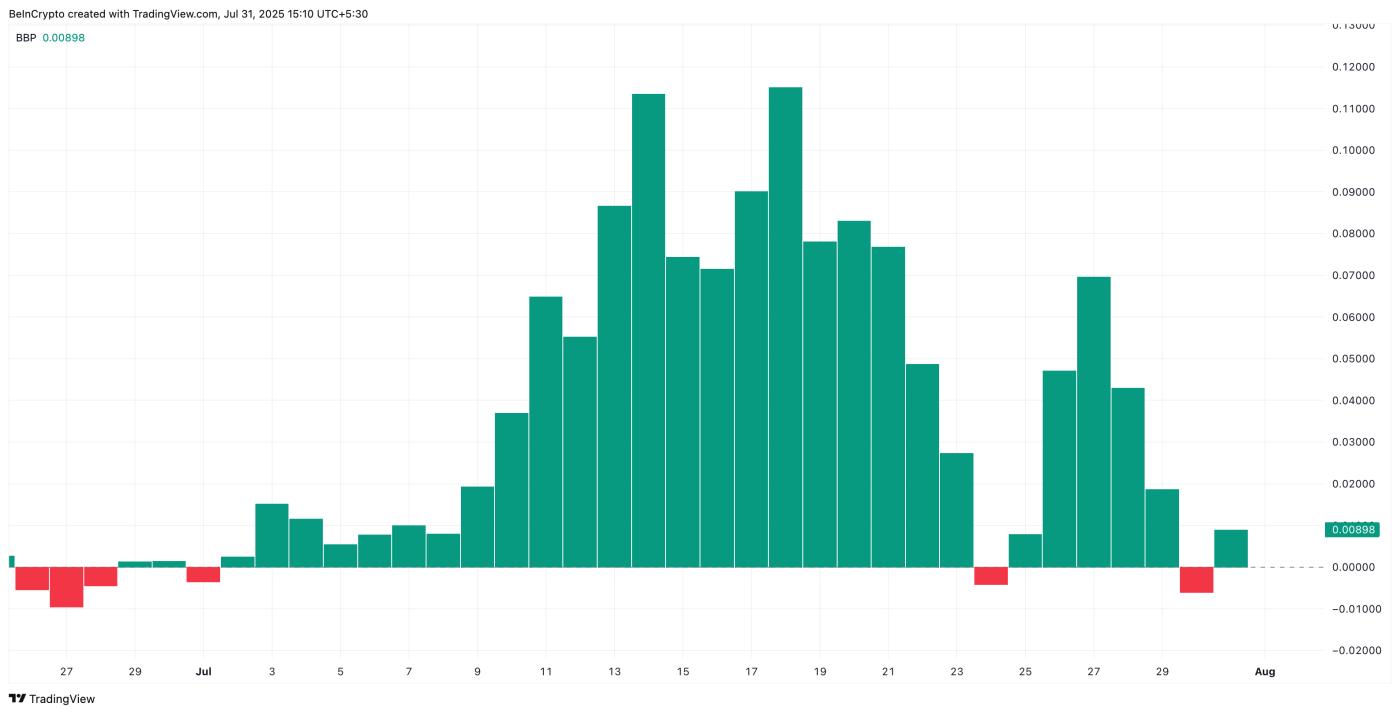 Bulls are in mild control: TradingView
This suggests bulls are temporarily in control, but this control is not unshakeable. Therefore, caution is needed ahead!
HBAR price structure struggles between weekly triangle and daily support: Who will win?
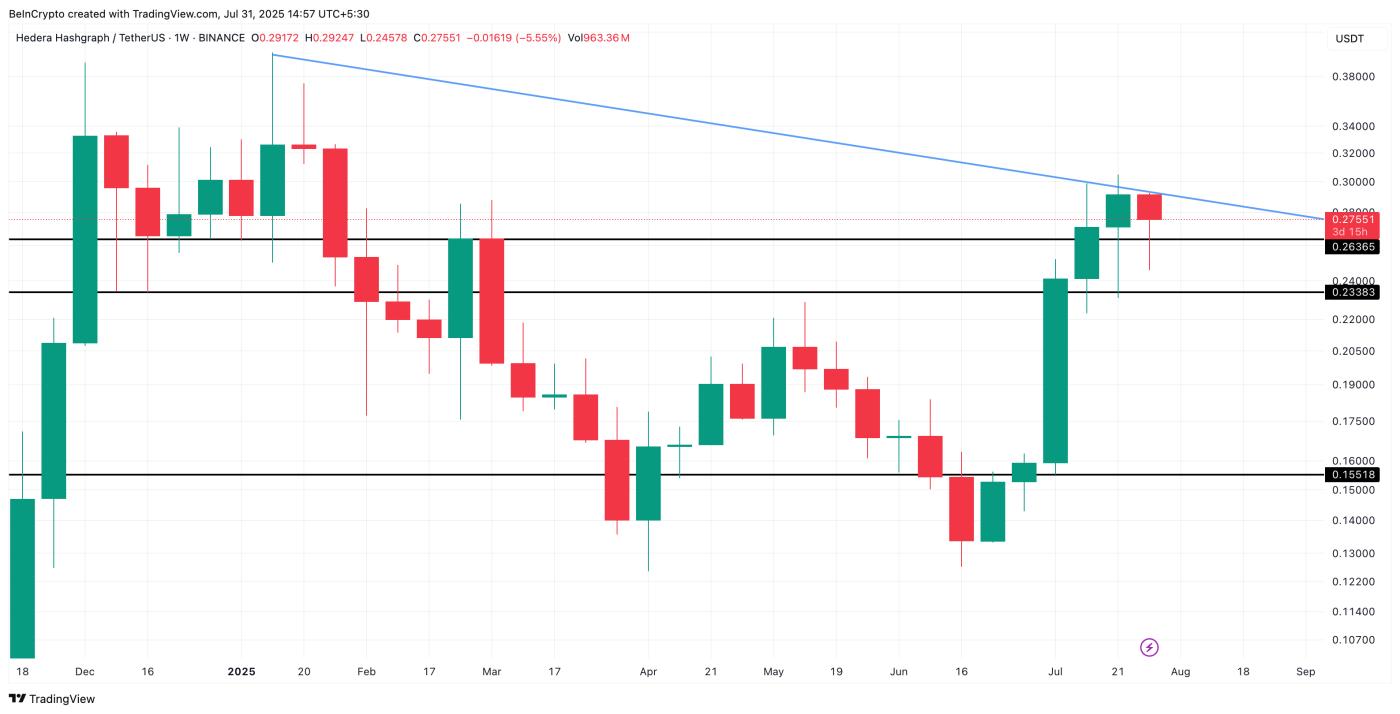
The weekly chart shows a mixed picture, with HBAR accumulating in a descending triangle, a pattern typically trending downward even during an uptrend. If the price cannot break above the triangle's upper trend line near 0.30 USD, history suggests August could bring a correction.
Currently, levels at 0.26 USD and 0.23 USD are providing support. If these are broken, the entire structure could quickly shift to a downward trend.
 HBAR weekly price action: TradingView
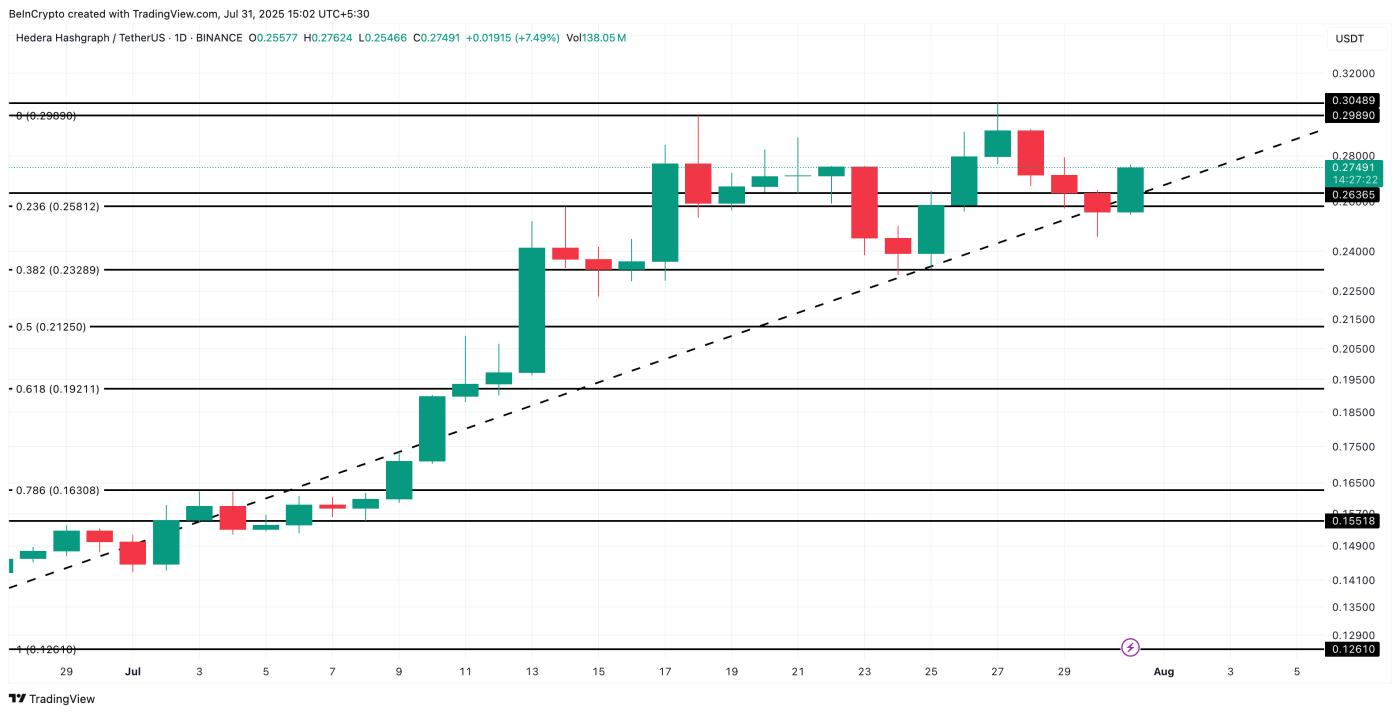
On the daily chart, Fibonacci retracement levels highlight important battle points.
 HBAR price analysis: TradingView
Immediate support is at 0.26 USD (same as on the weekly chart), followed by 0.23 USD and 0.21 USD. If bulls defend these areas, retesting the 0.29–0.30 USD level is still possible. A clear breakout above 0.30 USD would be the clearest sign that August might not follow the historical downward trend.


