

Hedera Hashgraph's native token HBAR declined by 15% last week, influenced by the overall market correction.
As the cryptocurrency market shows weak momentum, technical indicators suggest that HBAR's decline is not over.
HBAR Falls Below 20-Day Moving Average… Bearish Market
According to the daily chart analysis, HBAR's double-digit decline pushed the price below the 20-day exponential moving average (EMA).
Currently, this important moving average is forming a dynamic resistance above the token's price at $0.2446. Notably, HBAR is currently trading at $0.2391.
Want more token insights? Subscribe to editor Harsh Notariya's daily crypto newsletter [here].
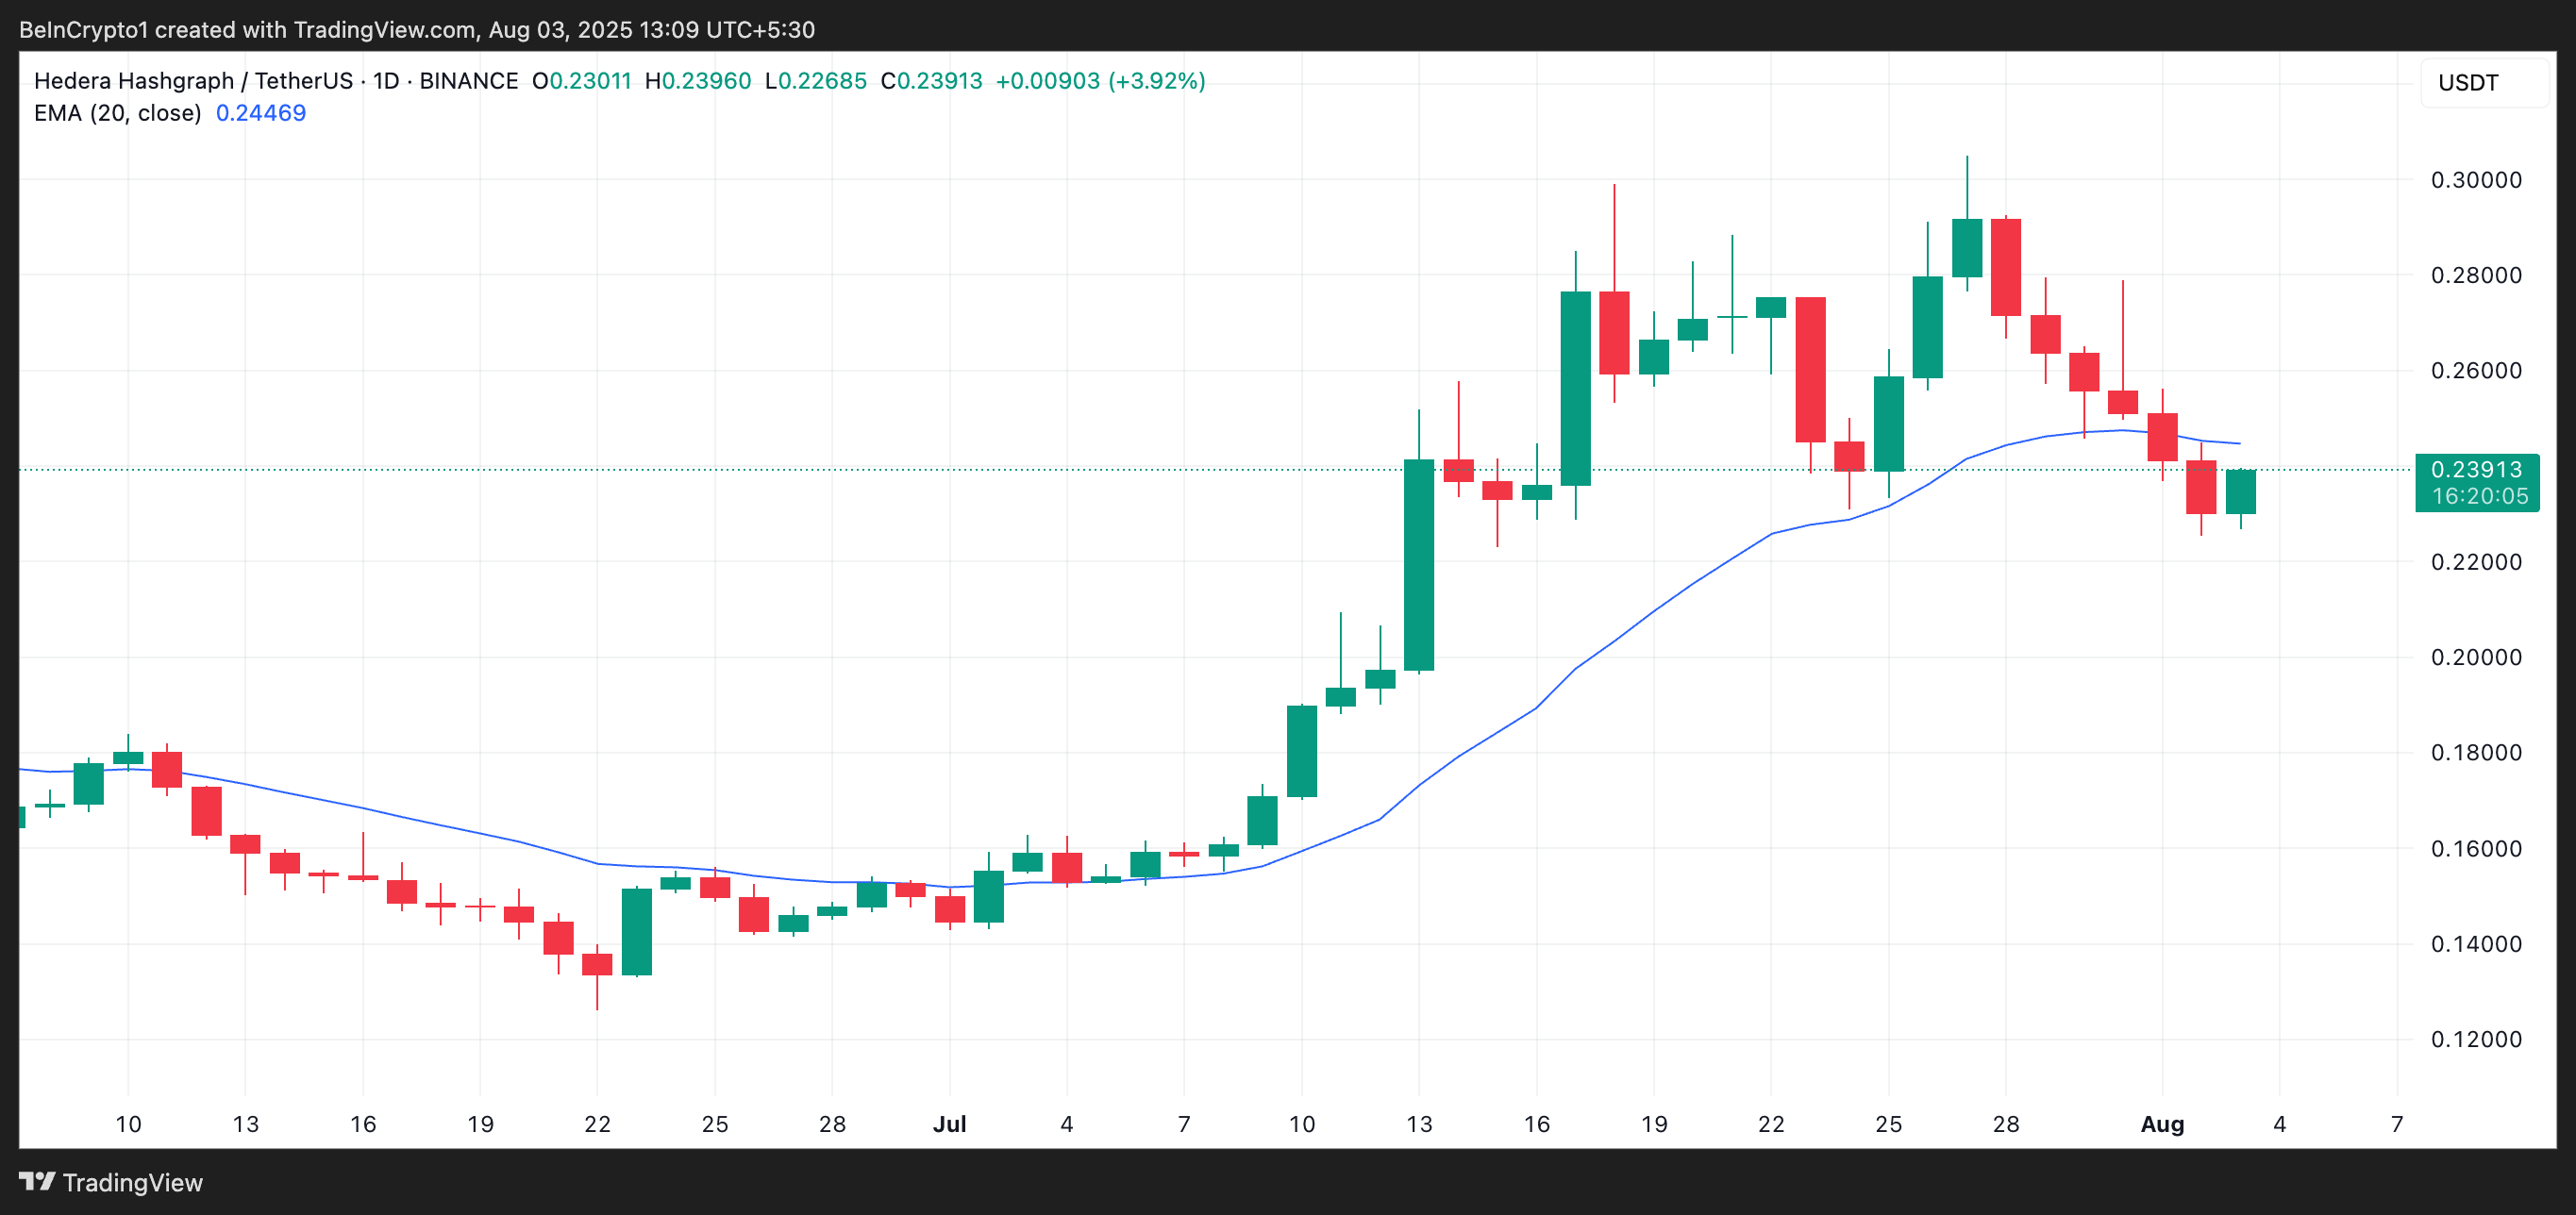
The 20-day EMA measures the average price of an asset over the past 20 trading days, giving more weight to recent prices. When the price trades above the 20-day EMA, it indicates short-term upward momentum and suggests buyers are in control.
Conversely, when the asset's price falls below this level, it indicates increased selling pressure and weakened short-term support. This puts HBAR at risk of recording more losses in the coming trading days.
Moreover, the Moving Average Convergence Divergence (MACD) indicator for the altcoin supports this bearish outlook.
Currently, HBAR's MACD line (blue) is positioned below the signal line (orange), with the red histogram bars growing larger, indicating accelerating bearish momentum.
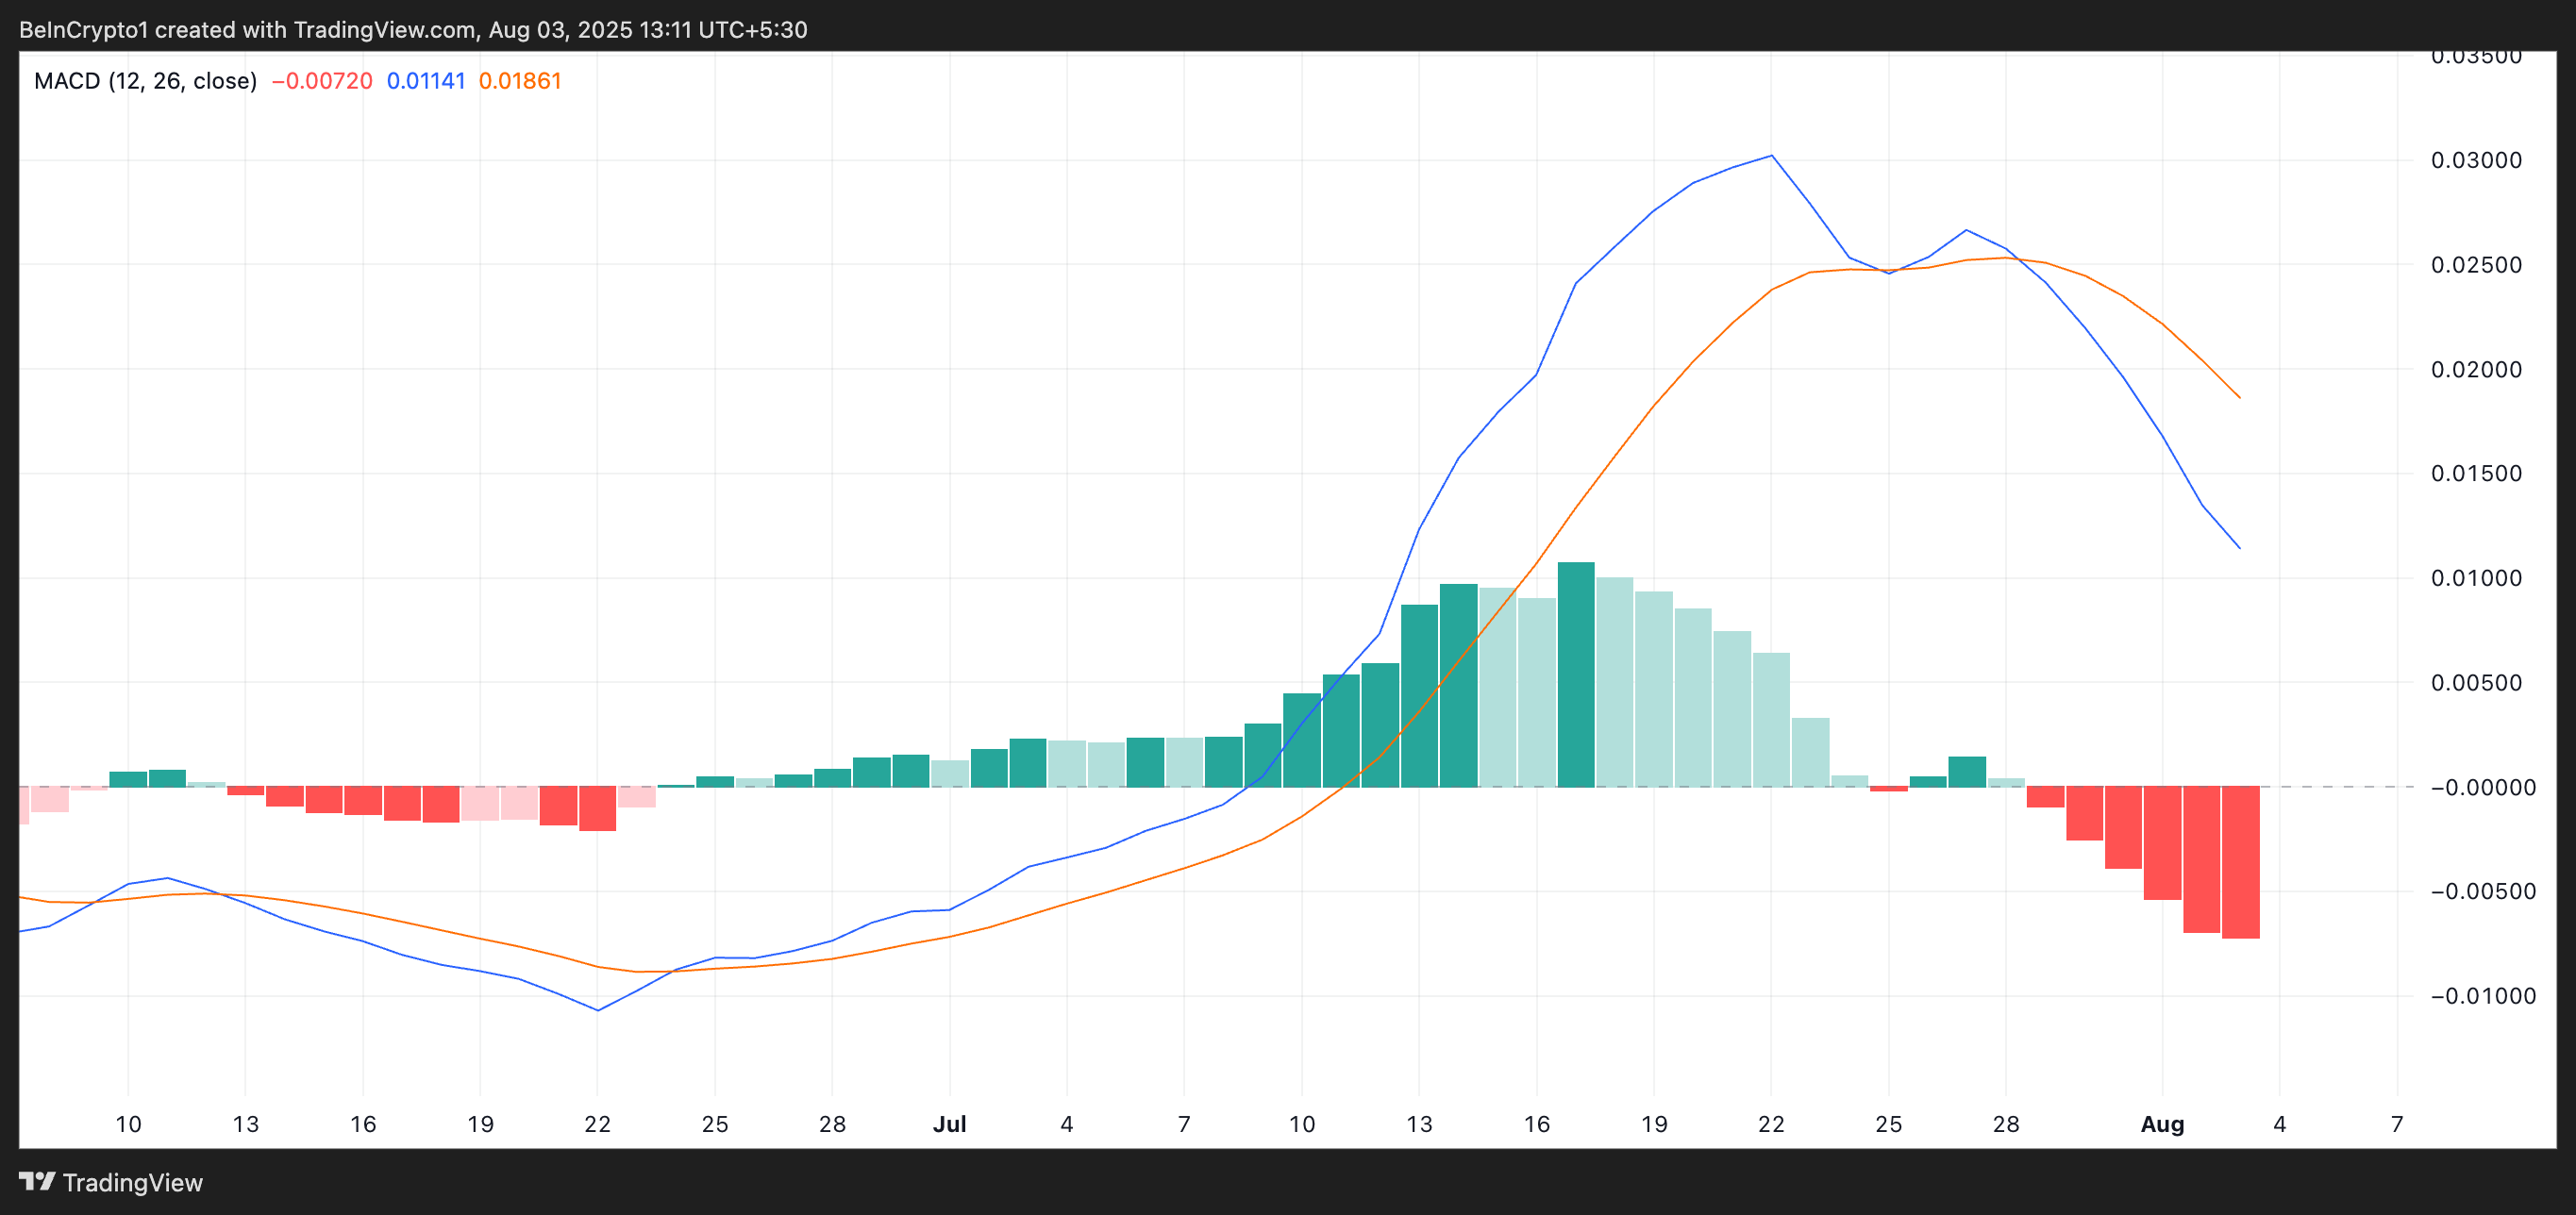
The MACD indicator helps identify price movement trends and momentum, capturing potential buy or sell signals through crossovers between the MACD and signal lines.
In HBAR's case, with the MACD line below the signal line, this indicates decreasing buying pressure and increasing selling side strength, supporting a short-term continuing downtrend.
Market Sentiment Change, Token Recovery?
As selling pressure intensifies, HBAR could move towards deeper losses, potentially falling below $0.2283.
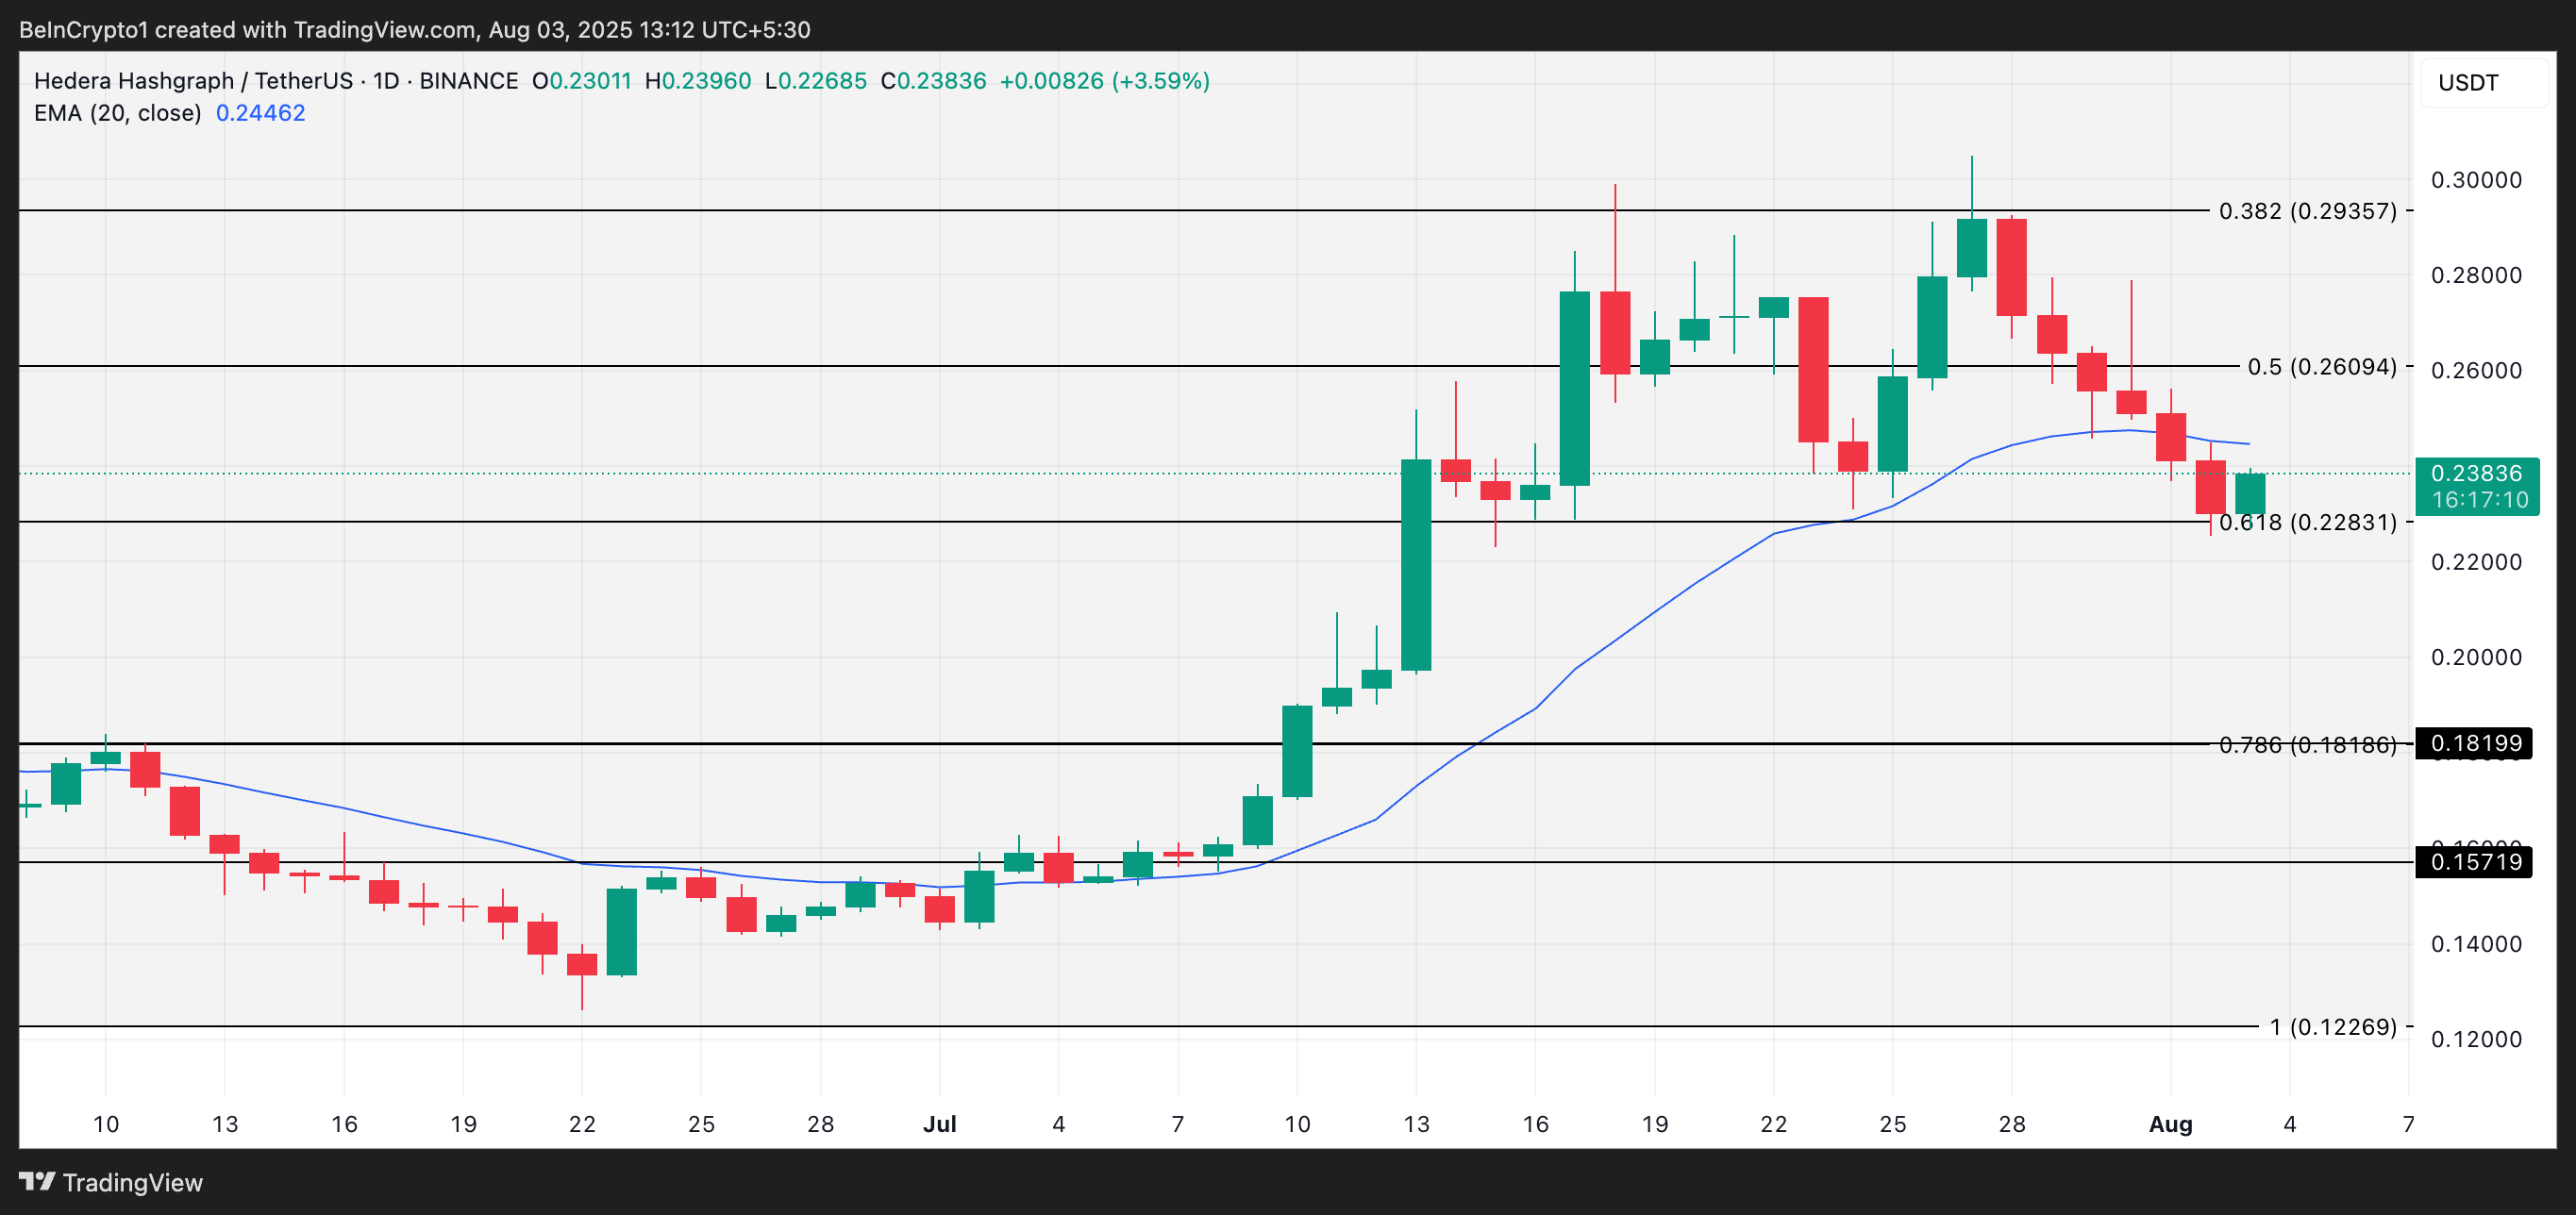
However, if market sentiment changes and a strong support base forms, the token's price could move above the 20-day EMA towards $0.2609.


