

While other cryptocurrencies are moving towards all-time highs, Pi Coin (PI) price continues to record new lows. The PI token has fallen 1.2% in the last 24 hours and has declined almost 25% over the past month. The most recent all-time low? Just yesterday.
However, some technical signals indicate that PI price may be on the verge of a short-term reversal. Specific divergences on the chart, weakening selling pressure, and rising sentiment could be turning points.
Bull, Losing Strength and Switching to Bull
Sellers have firmly dominated the PI trend for several weeks. So now the Bull-Bear Power (BBP) indicator is crucial. As the downtrend lengthens and selling pressure begins to weaken, this can often indicate that sellers are losing strength.
This is exactly what the chart is beginning to show. BBP has been rising since August 1st and is transitioning to a less aggressive print in the deep negative area. This is similar to what occurred between July 15th and 21st. At that time, weakening downward momentum preceded a move from $0.45 to $0.52.
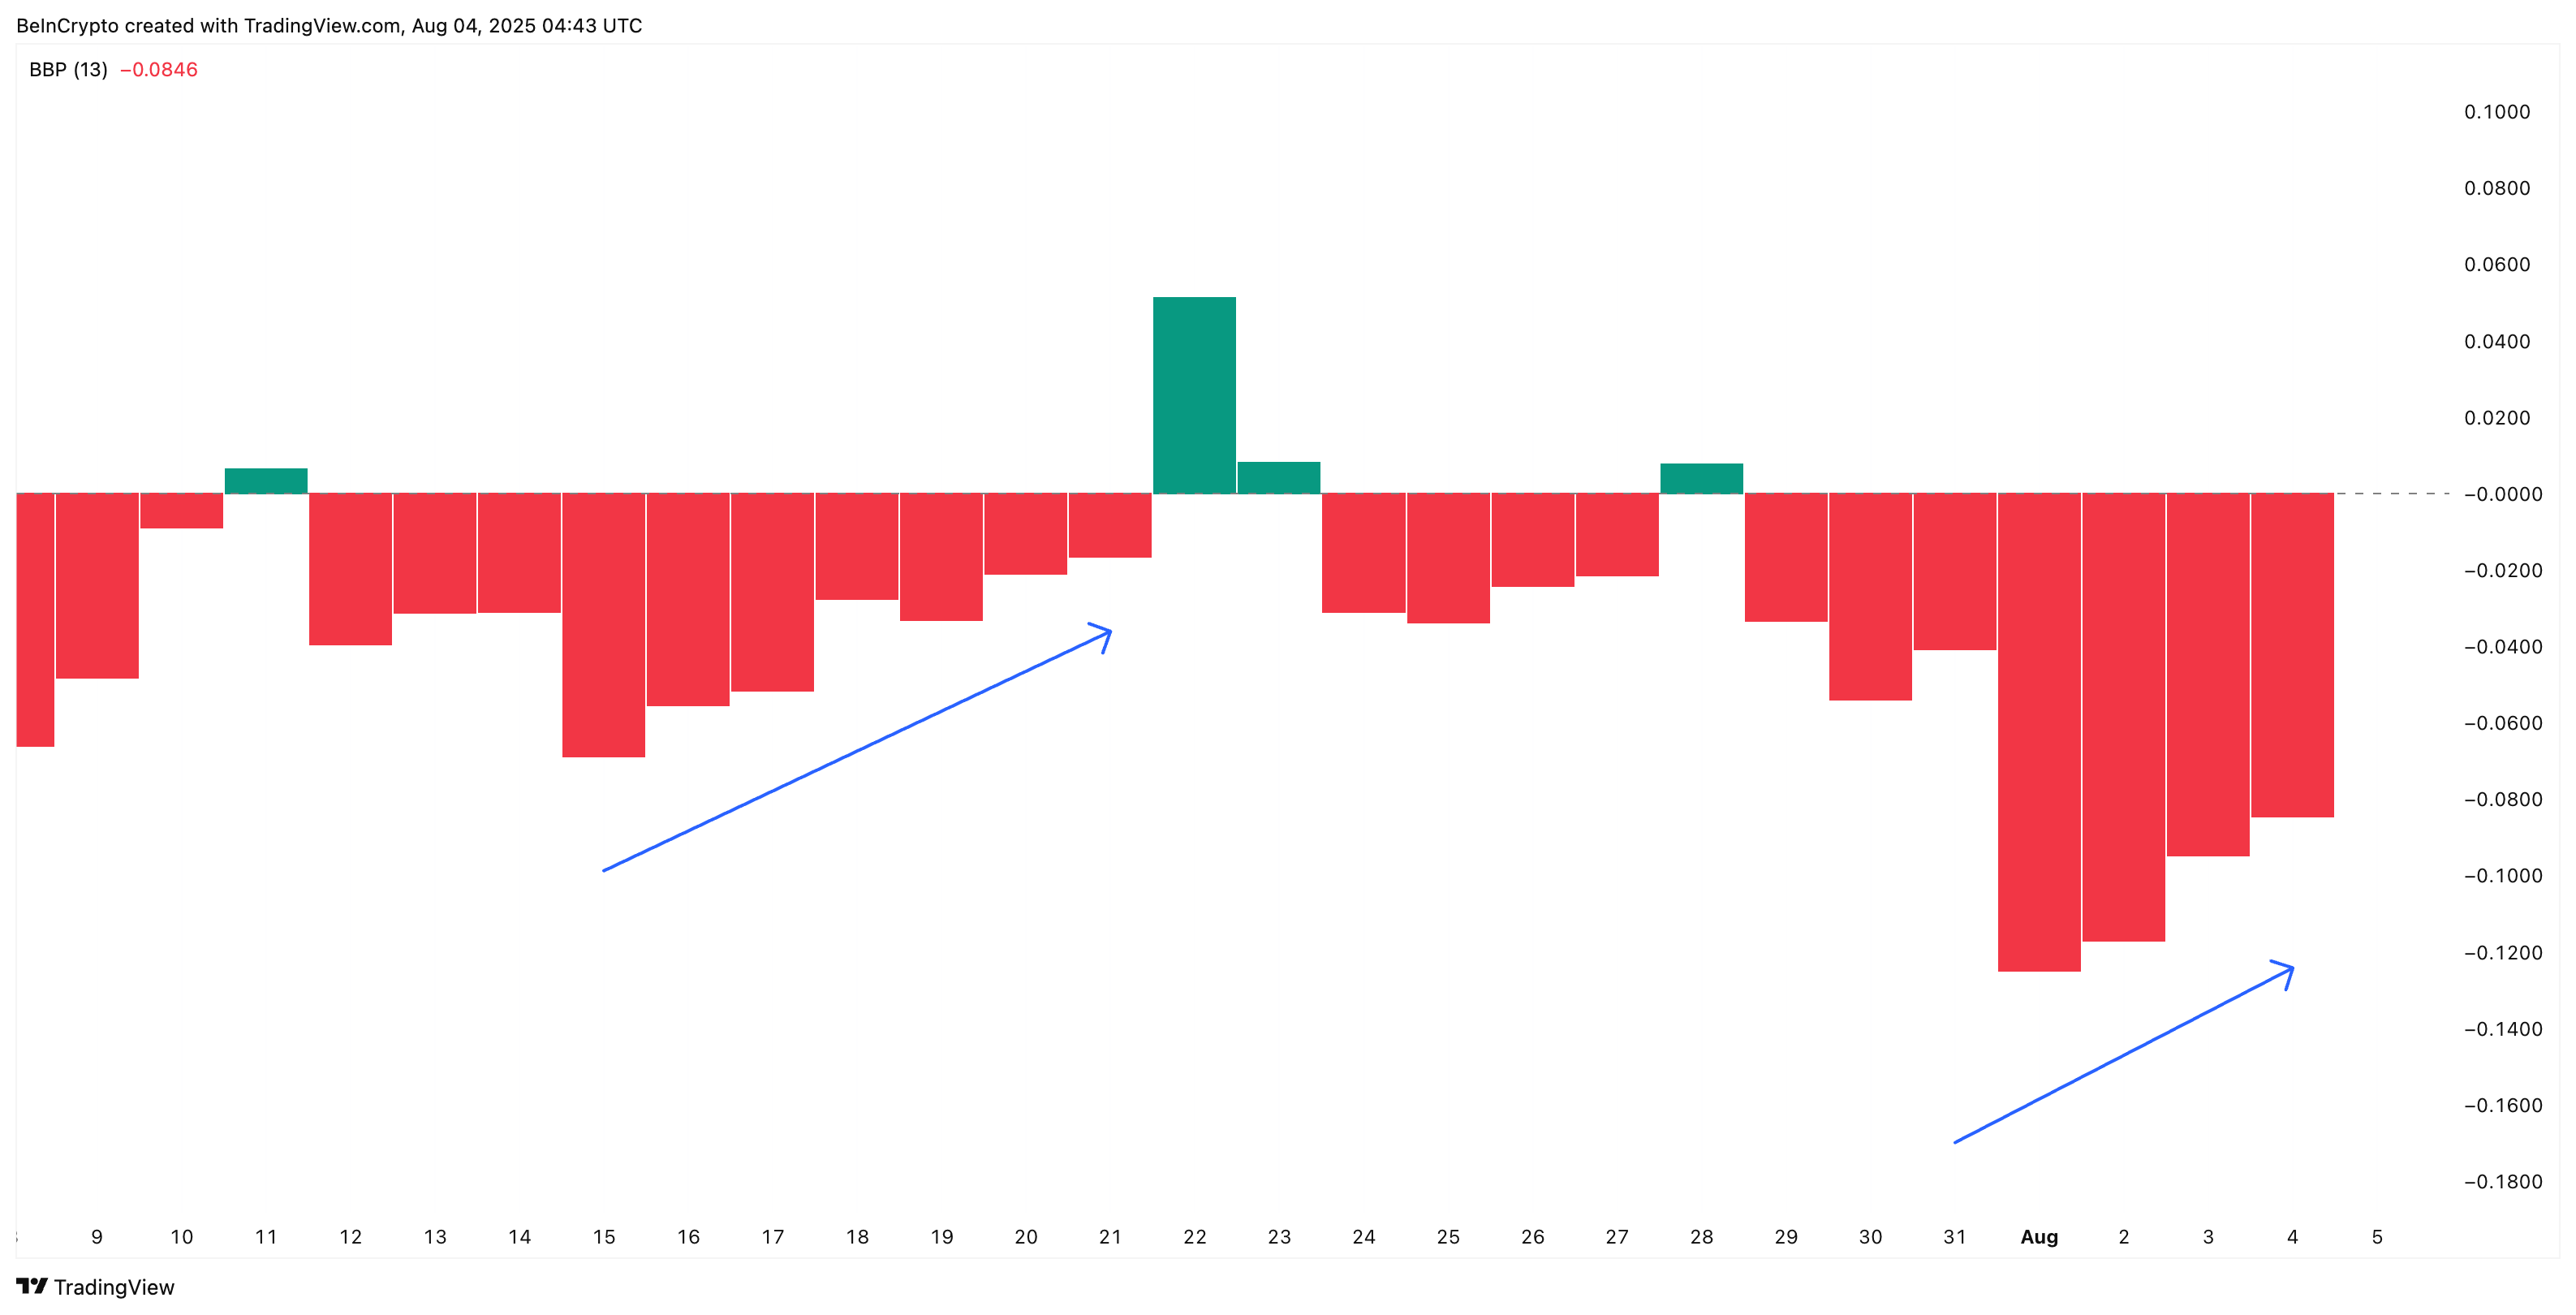
The Bull-Bear Power indicator tracks the difference between the highest price and the short-term moving average to show whether buyers or sellers are currently dominating.
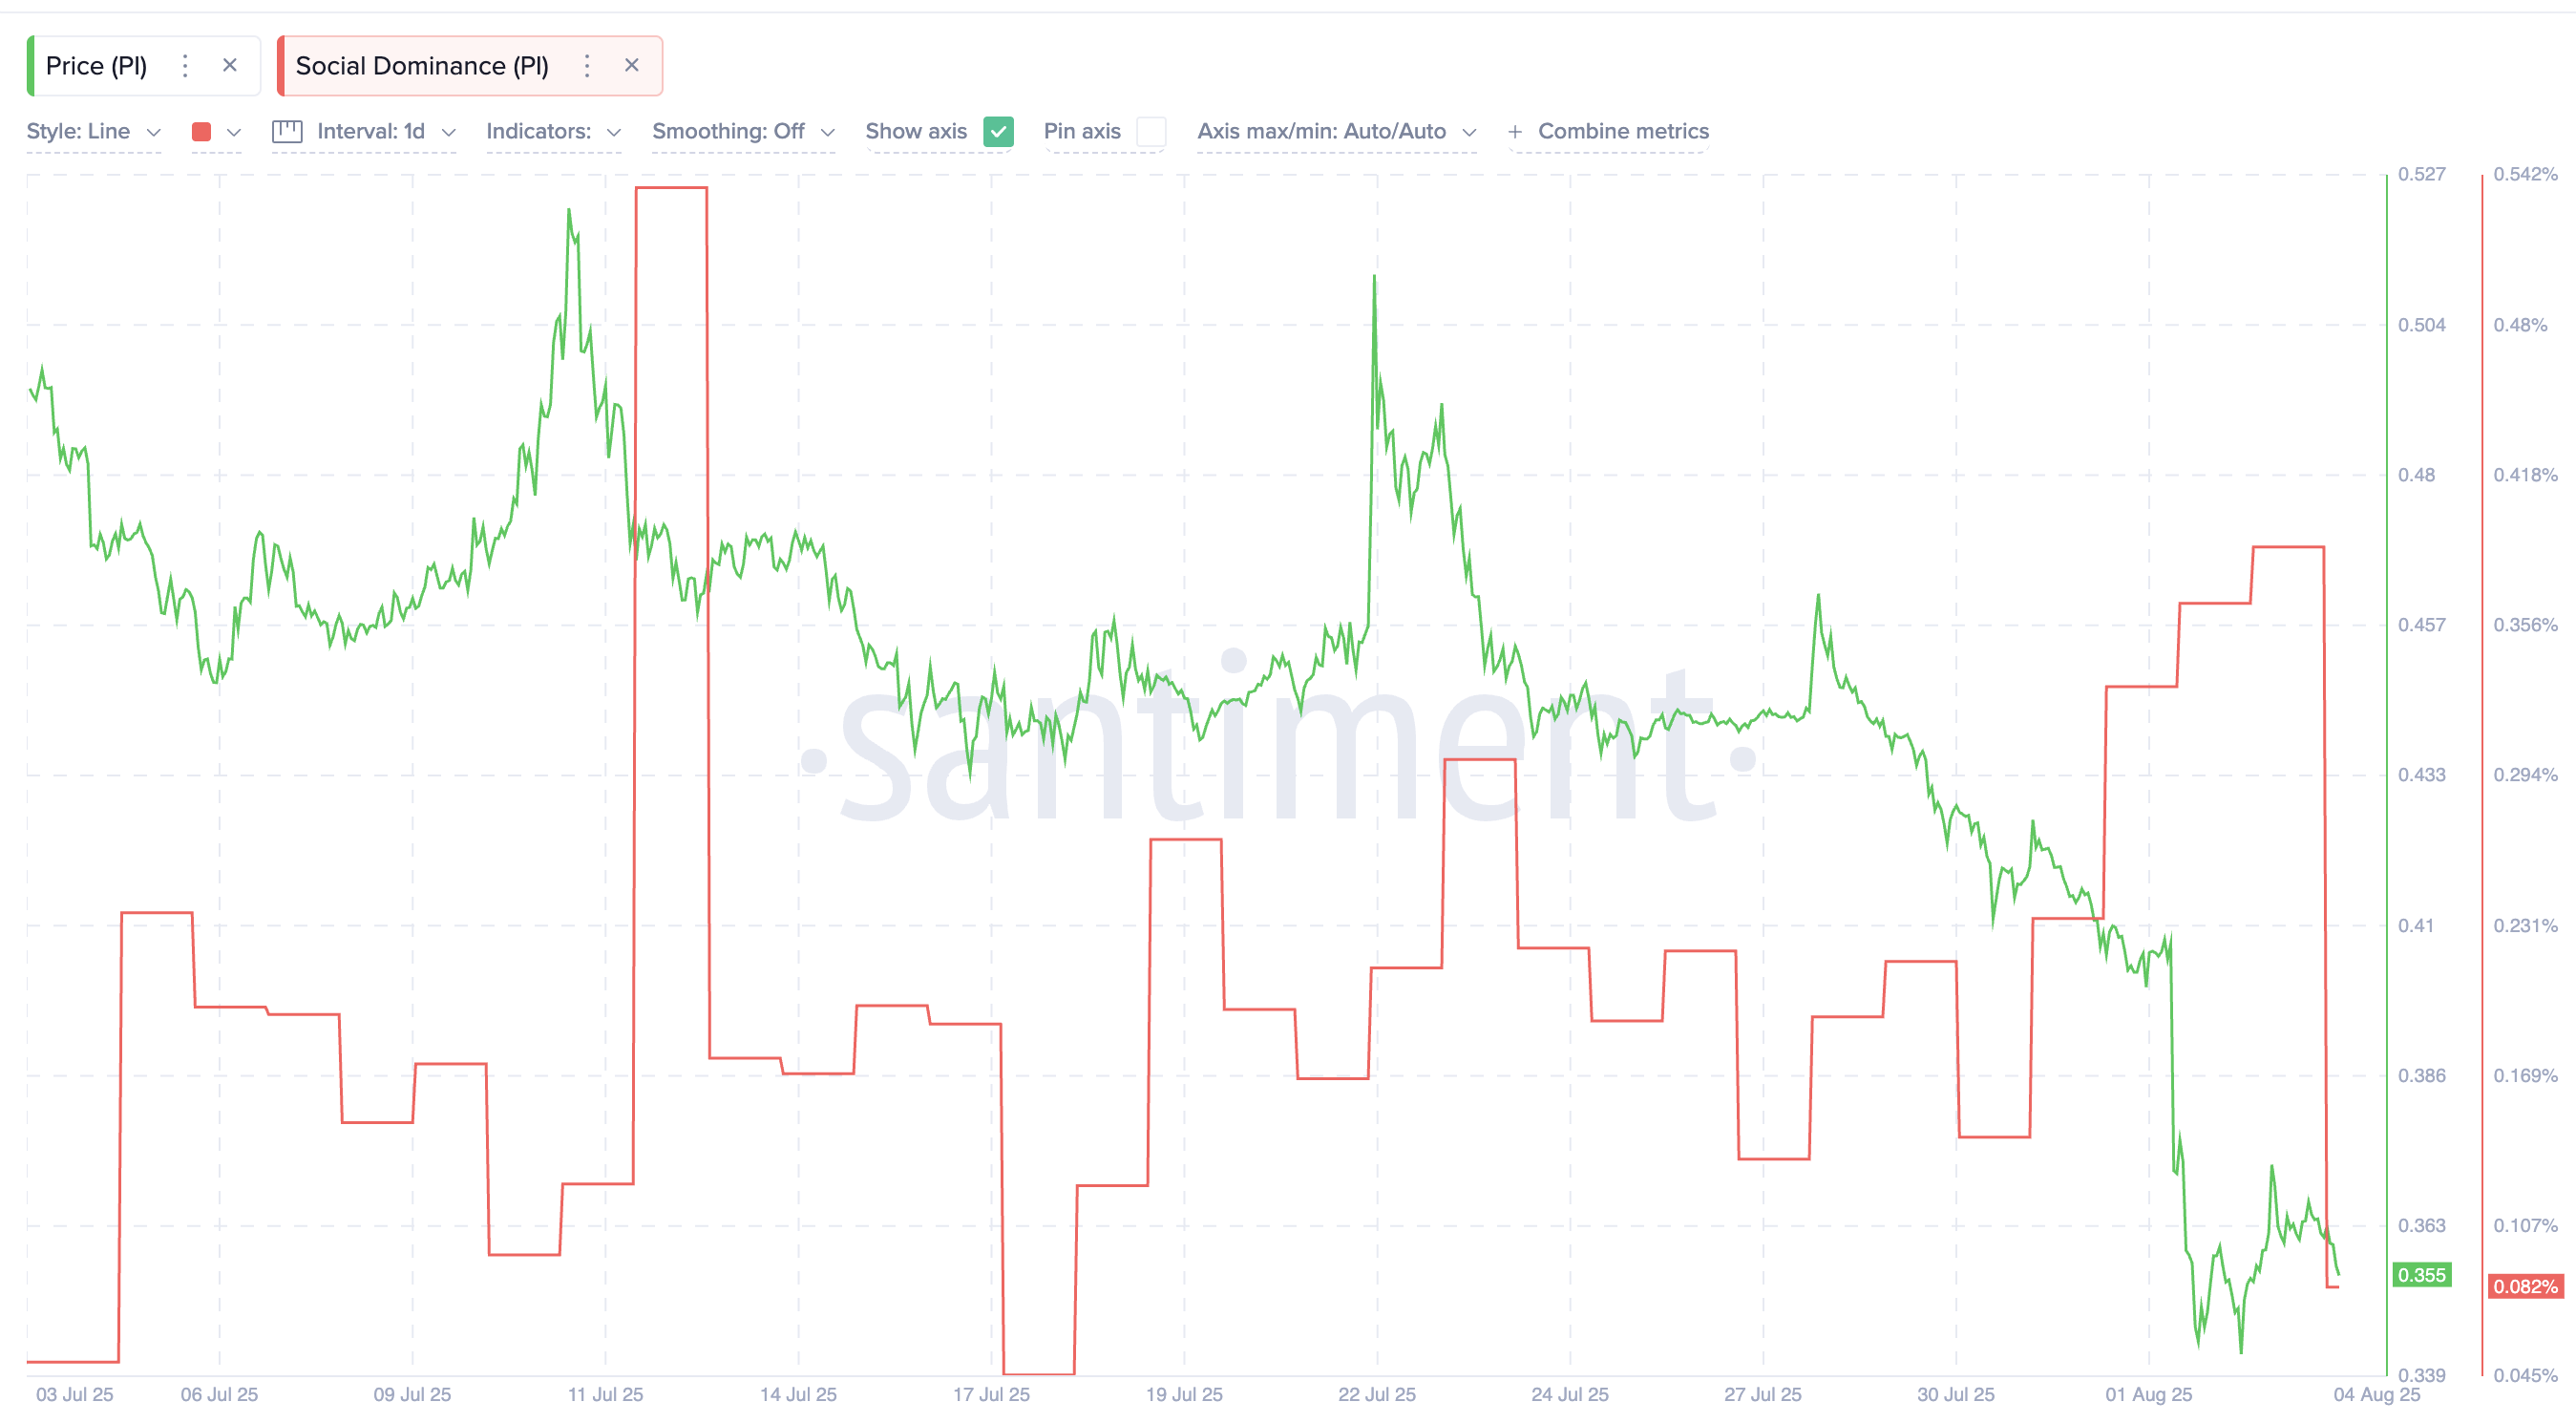
This is supported by social dominance, which measures the proportion of cryptocurrency conversation about PI. From August 1st to 3rd, PI's social dominance formed three consecutive higher highs, similar to the period from July 15th to 23rd. The previous period coincided with a local price bottom and led to a surge to $0.52.
Token TA and Market Update: Want more of these token insights? Subscribe to the daily crypto newsletter by editor Harsh Notariya here.
The alignment of sentiment and weakening downtrend now adds weight to the idea that PI price may be preparing for another rise.
RSI Bullish Divergence... Pi Coin Price Response Needed
The Relative Strength Index (RSI) is currently at 23.37, indicating an oversold area. However, beyond the numbers, the forming pattern is more important.
PI's price has recently created a higher low, while the RSI has created a lower low. This setup is known as a hidden bullish divergence and often appears before a local bottom.
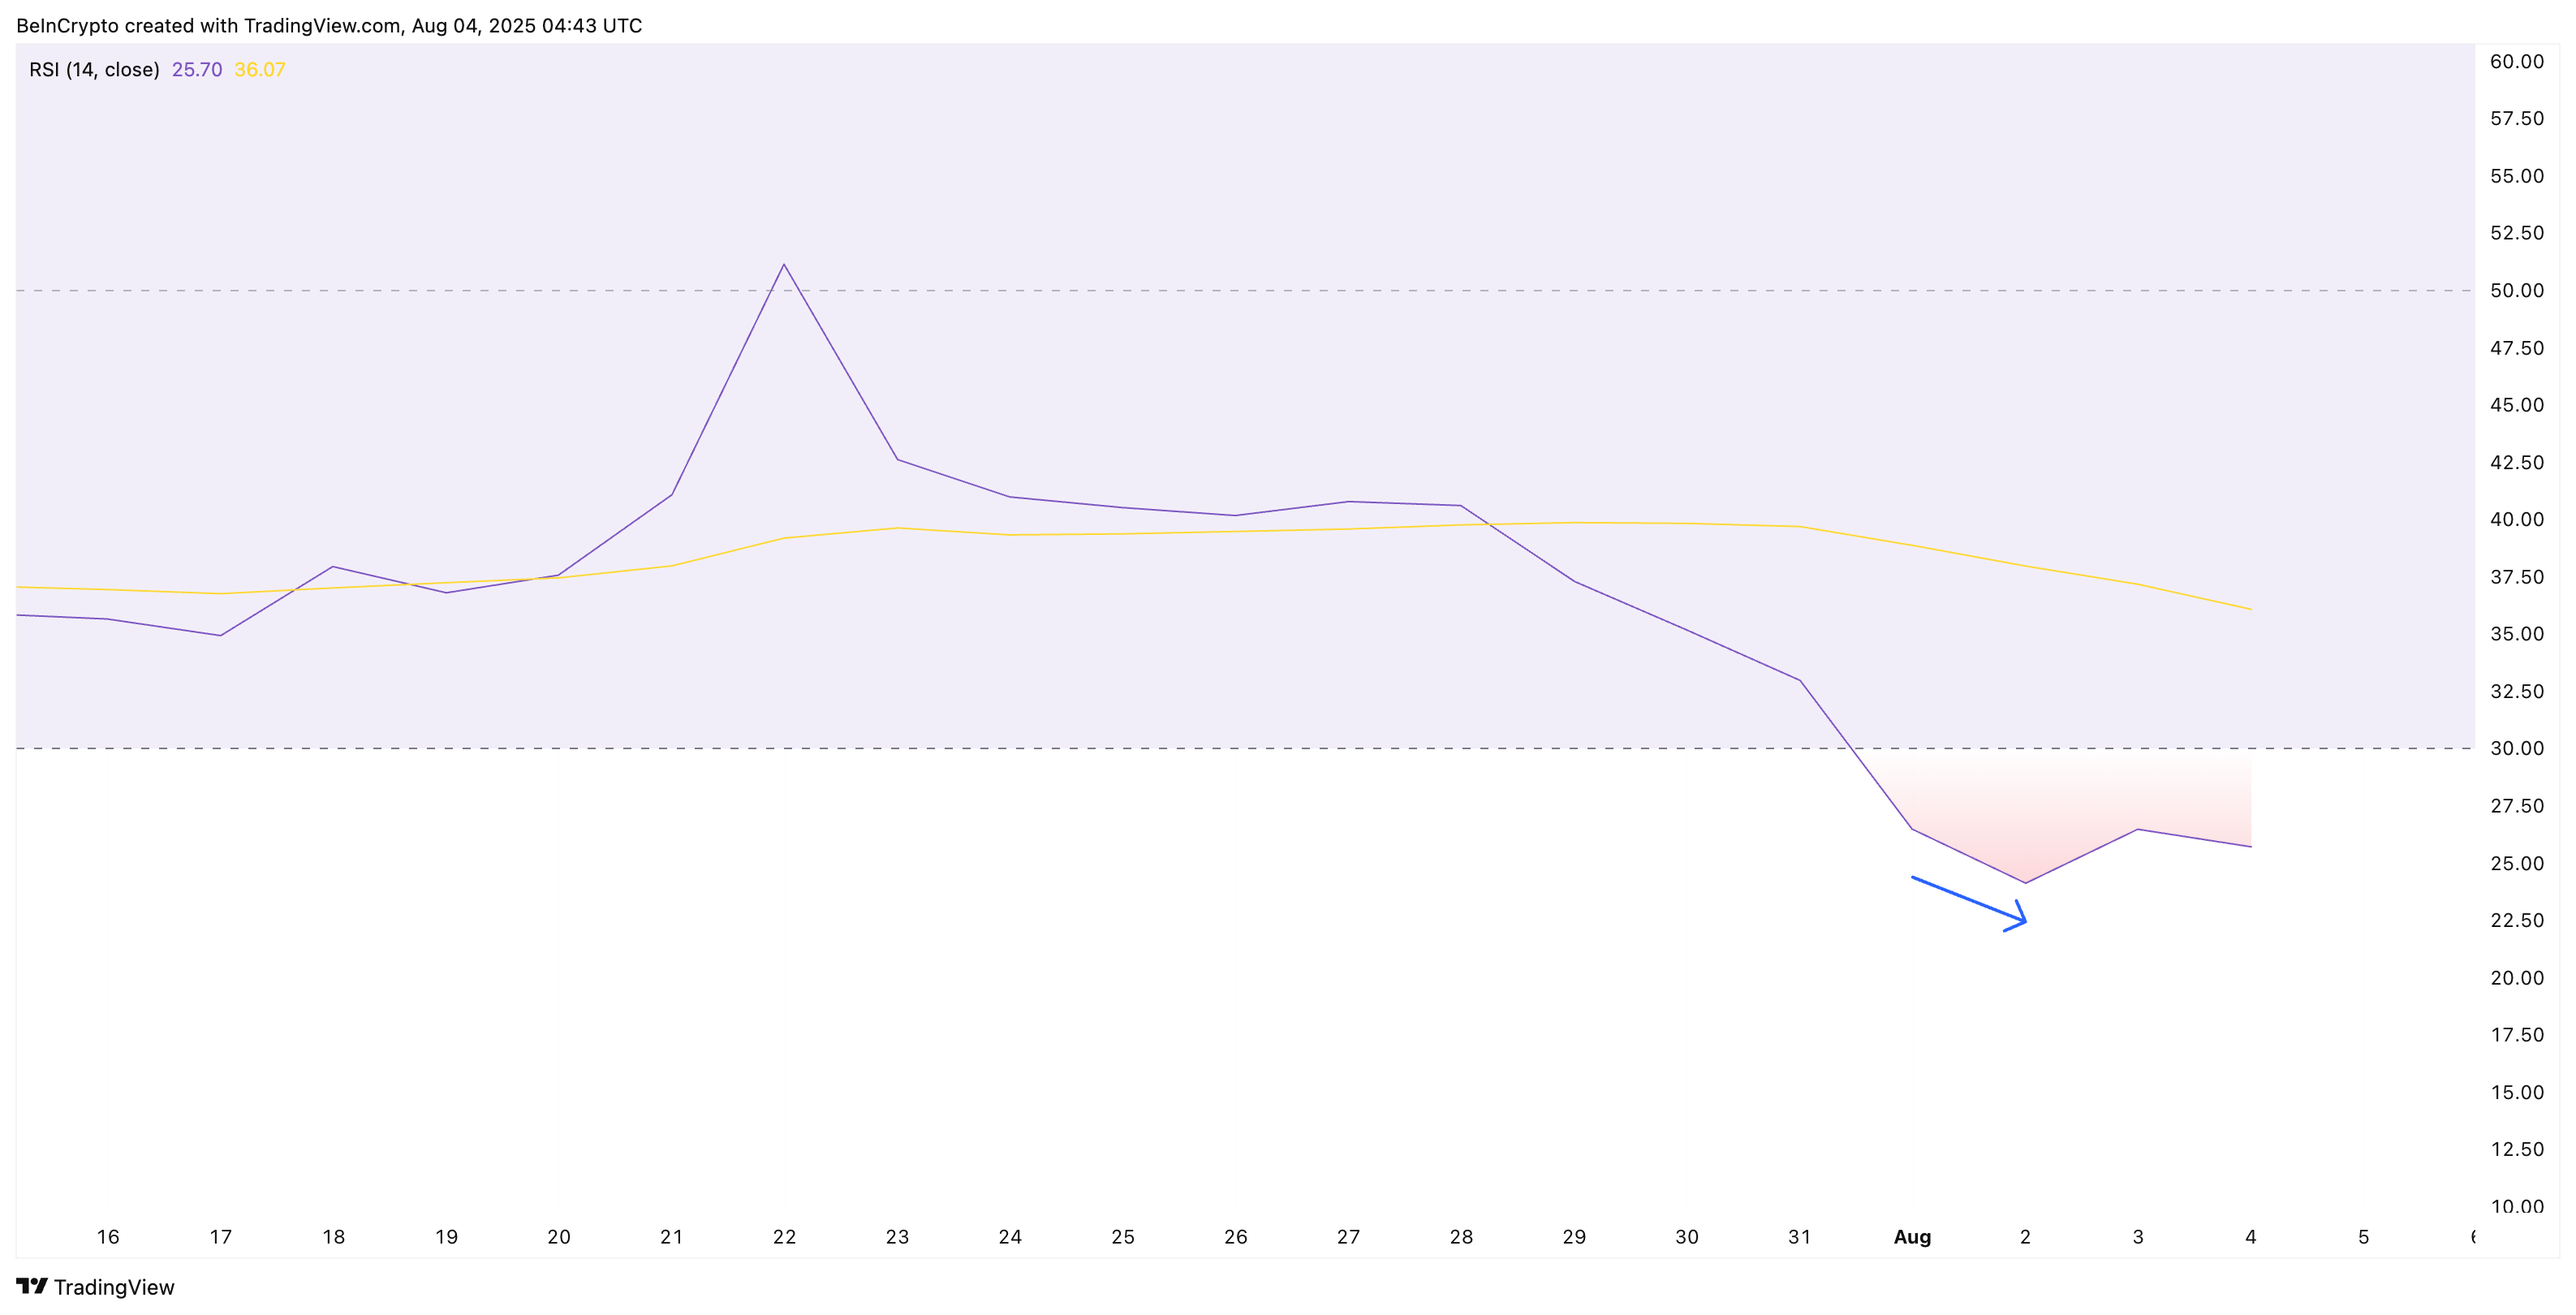
Initially, a declining RSI might seem bearish. However, when the price does not go lower, this usually indicates that downward momentum is weakening. This shows that selling pressure cannot push the price further down and can be a bottom signal.
However, this type of RSI divergence alone cannot confirm a rebound, especially when the PI coin price is declining. It is closer to a subtle early signal.
For this to happen, the price needs to break through resistance.
RSI is a momentum indicator that tracks the speed and change of price movements. Values below 30 often indicate an oversold asset with potential for reversal.
PI Price Must Break $0.369 for Bullish Signal
The Pi Coin price is currently trading around $0.35. Based on the Fibonacci retracement from the July 22nd high ($0.52) to the July 31st low ($0.32), the next major resistances are $0.36, followed by $0.39 and $0.42.
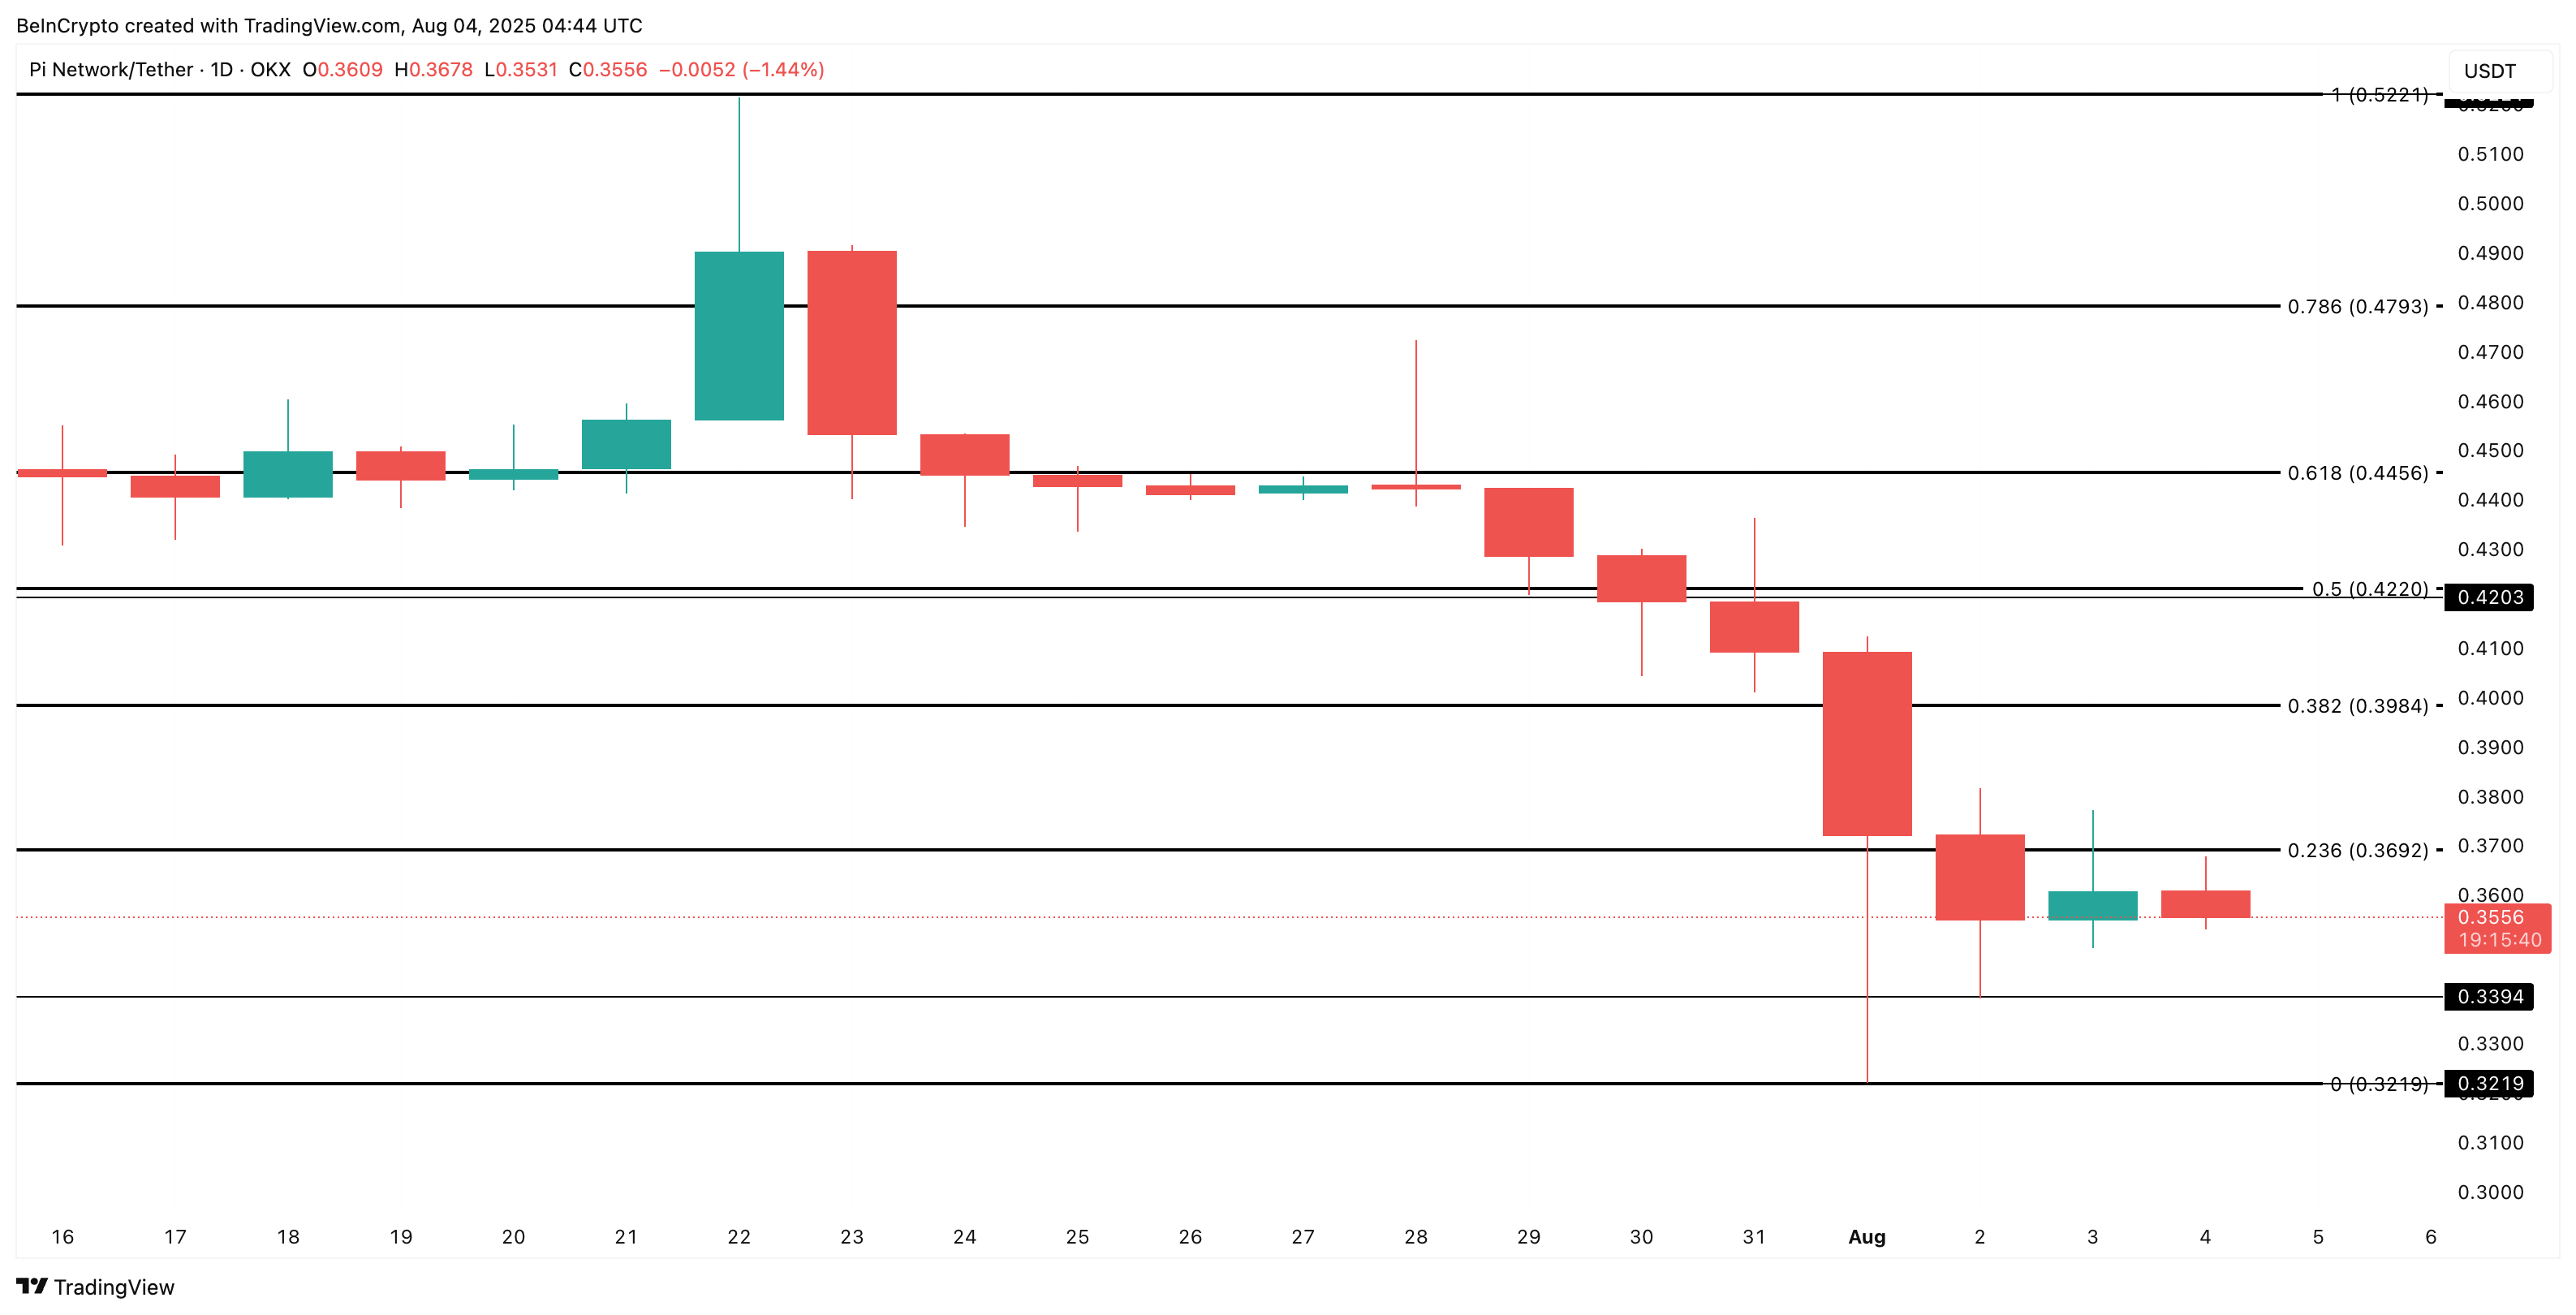
A daily close above $0.39 would be the first signal that buyers are regaining dominance. However, if PI falls below $0.32, the bullish divergence setup would be invalidated, and the trend could continue to decline.
Until then, the Pi Coin chart may still look heavy. But for the first time in weeks, its trajectory may be changing. This potential change should be supported by RSI improvement (possibly higher highs or lower highs) and further reduction in downward pressure.


