

The cryptocurrency market showed a somewhat unstable start in early August, but HBAR price is demonstrating resilience. This token has risen by more than 4% in the past 24 hours and maintains a monthly increase of over 60%. Its three-month performance is still up by more than 43%.
Despite volatility, the overall upward trend is still maintained. The key question now is whether HBAR can convert its on-chain strength into a technical breakthrough.
Continuous Outflow, Holder Confidence
HBAR has recorded strong negative net outflows for two consecutive weeks: –$46.49 million and –$40.85 million. This indicates a clear trend of tokens leaving exchanges, which generally reflects investor confidence and suggests a potential reduction in immediate selling pressure.
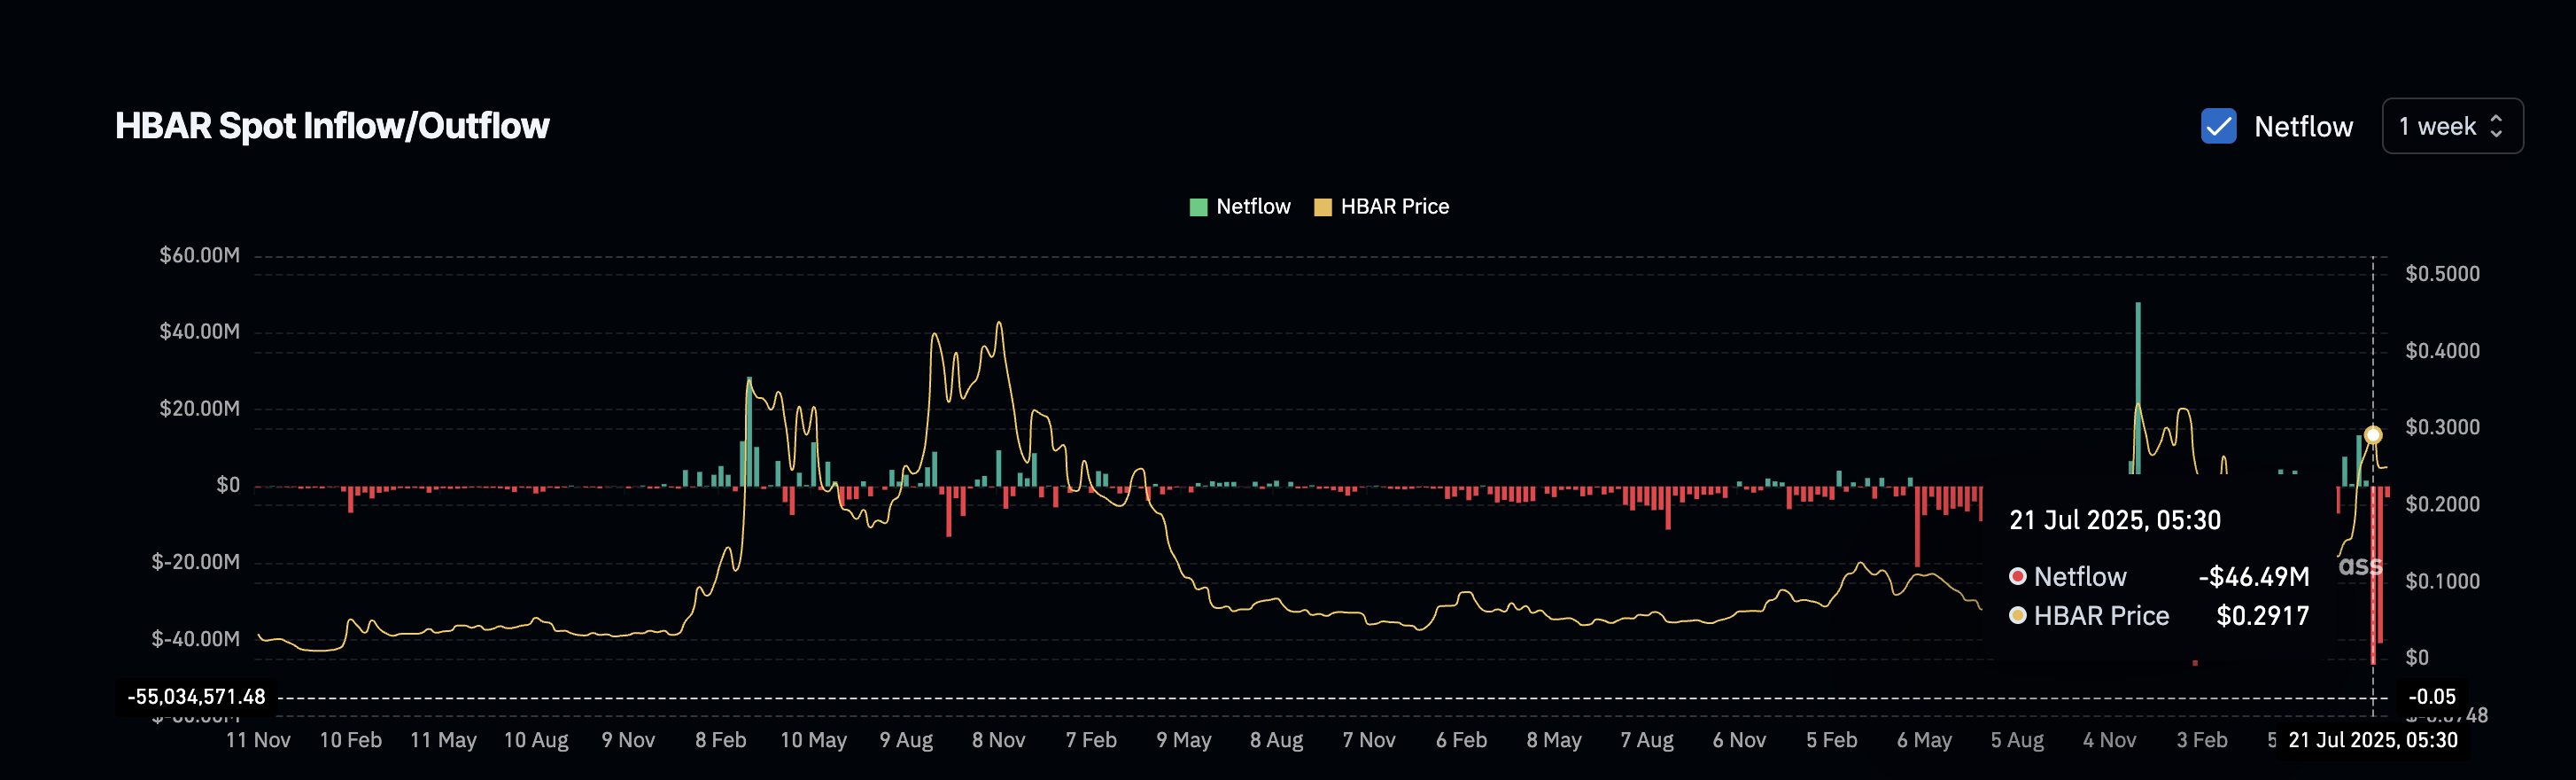
A new week has just begun, and traders should pay attention to the next set of outflows. A third week of negative net outflow will add more weight to the accumulation pattern.
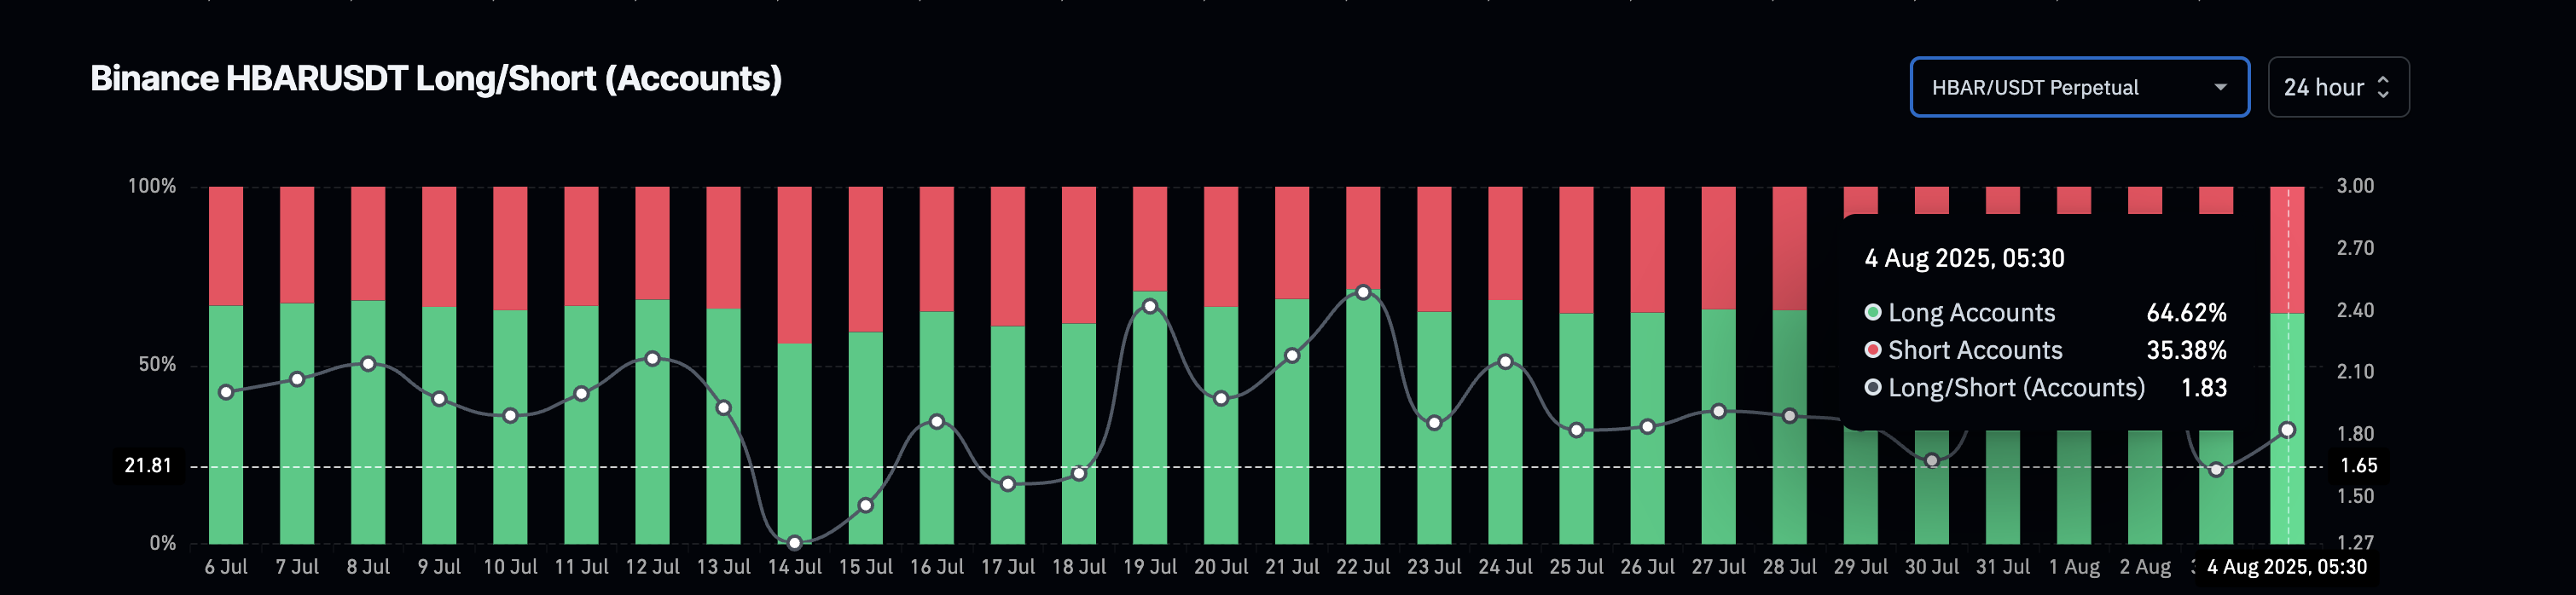
Supporting this is the Binance Longing-Short account ratio, which is positioned at around 1.83. This means nearly two-thirds of accounts trading HBAR are taking Longing positions. Unlike the Longing/Short volume ratio that tracks trade size, this indicator reflects how many traders are betting on price increases. Steady outflows and high Longing account dominance confirm a positive flow in market structure.
Token TA and Market Update: Want more such token insights? Subscribe to editor Harsh Notariya's daily crypto newsletter here.
Short-term RSI Divergence…Continued Strength?
To capture momentum early, we move to the 4-hour chart, ideal for capturing short-term trend changes. From August 1st to August 4th, the price formed slightly lower peaks ($0.255 to $0.253), but the RSI (Relative Strength Index) surged from 42 to 52 during the same period.

This is a typical case of hidden positive divergence, signaling trend continuation rather than reversal. While not a breakthrough trigger by itself, when combined with net outflow and positioning data, it reinforces continued upward movement.
The Relative Strength Index (RSI) is a momentum measurement indicator that helps identify overbought or oversold conditions by measuring the speed and change of price movements.
HBAR Price Pattern Breakthrough…Key Fibonacci Levels
HBAR is forming a clear ascending triangle, which is a positive continuation pattern. The ascending support trendline started in June, with horizontal resistance levels being repeatedly tested. A breakthrough above $0.27 will confirm the pattern, but $0.29 remains a significant resistance derived from the trend-based Fibonacci extension level from $0.12 to $0.29.
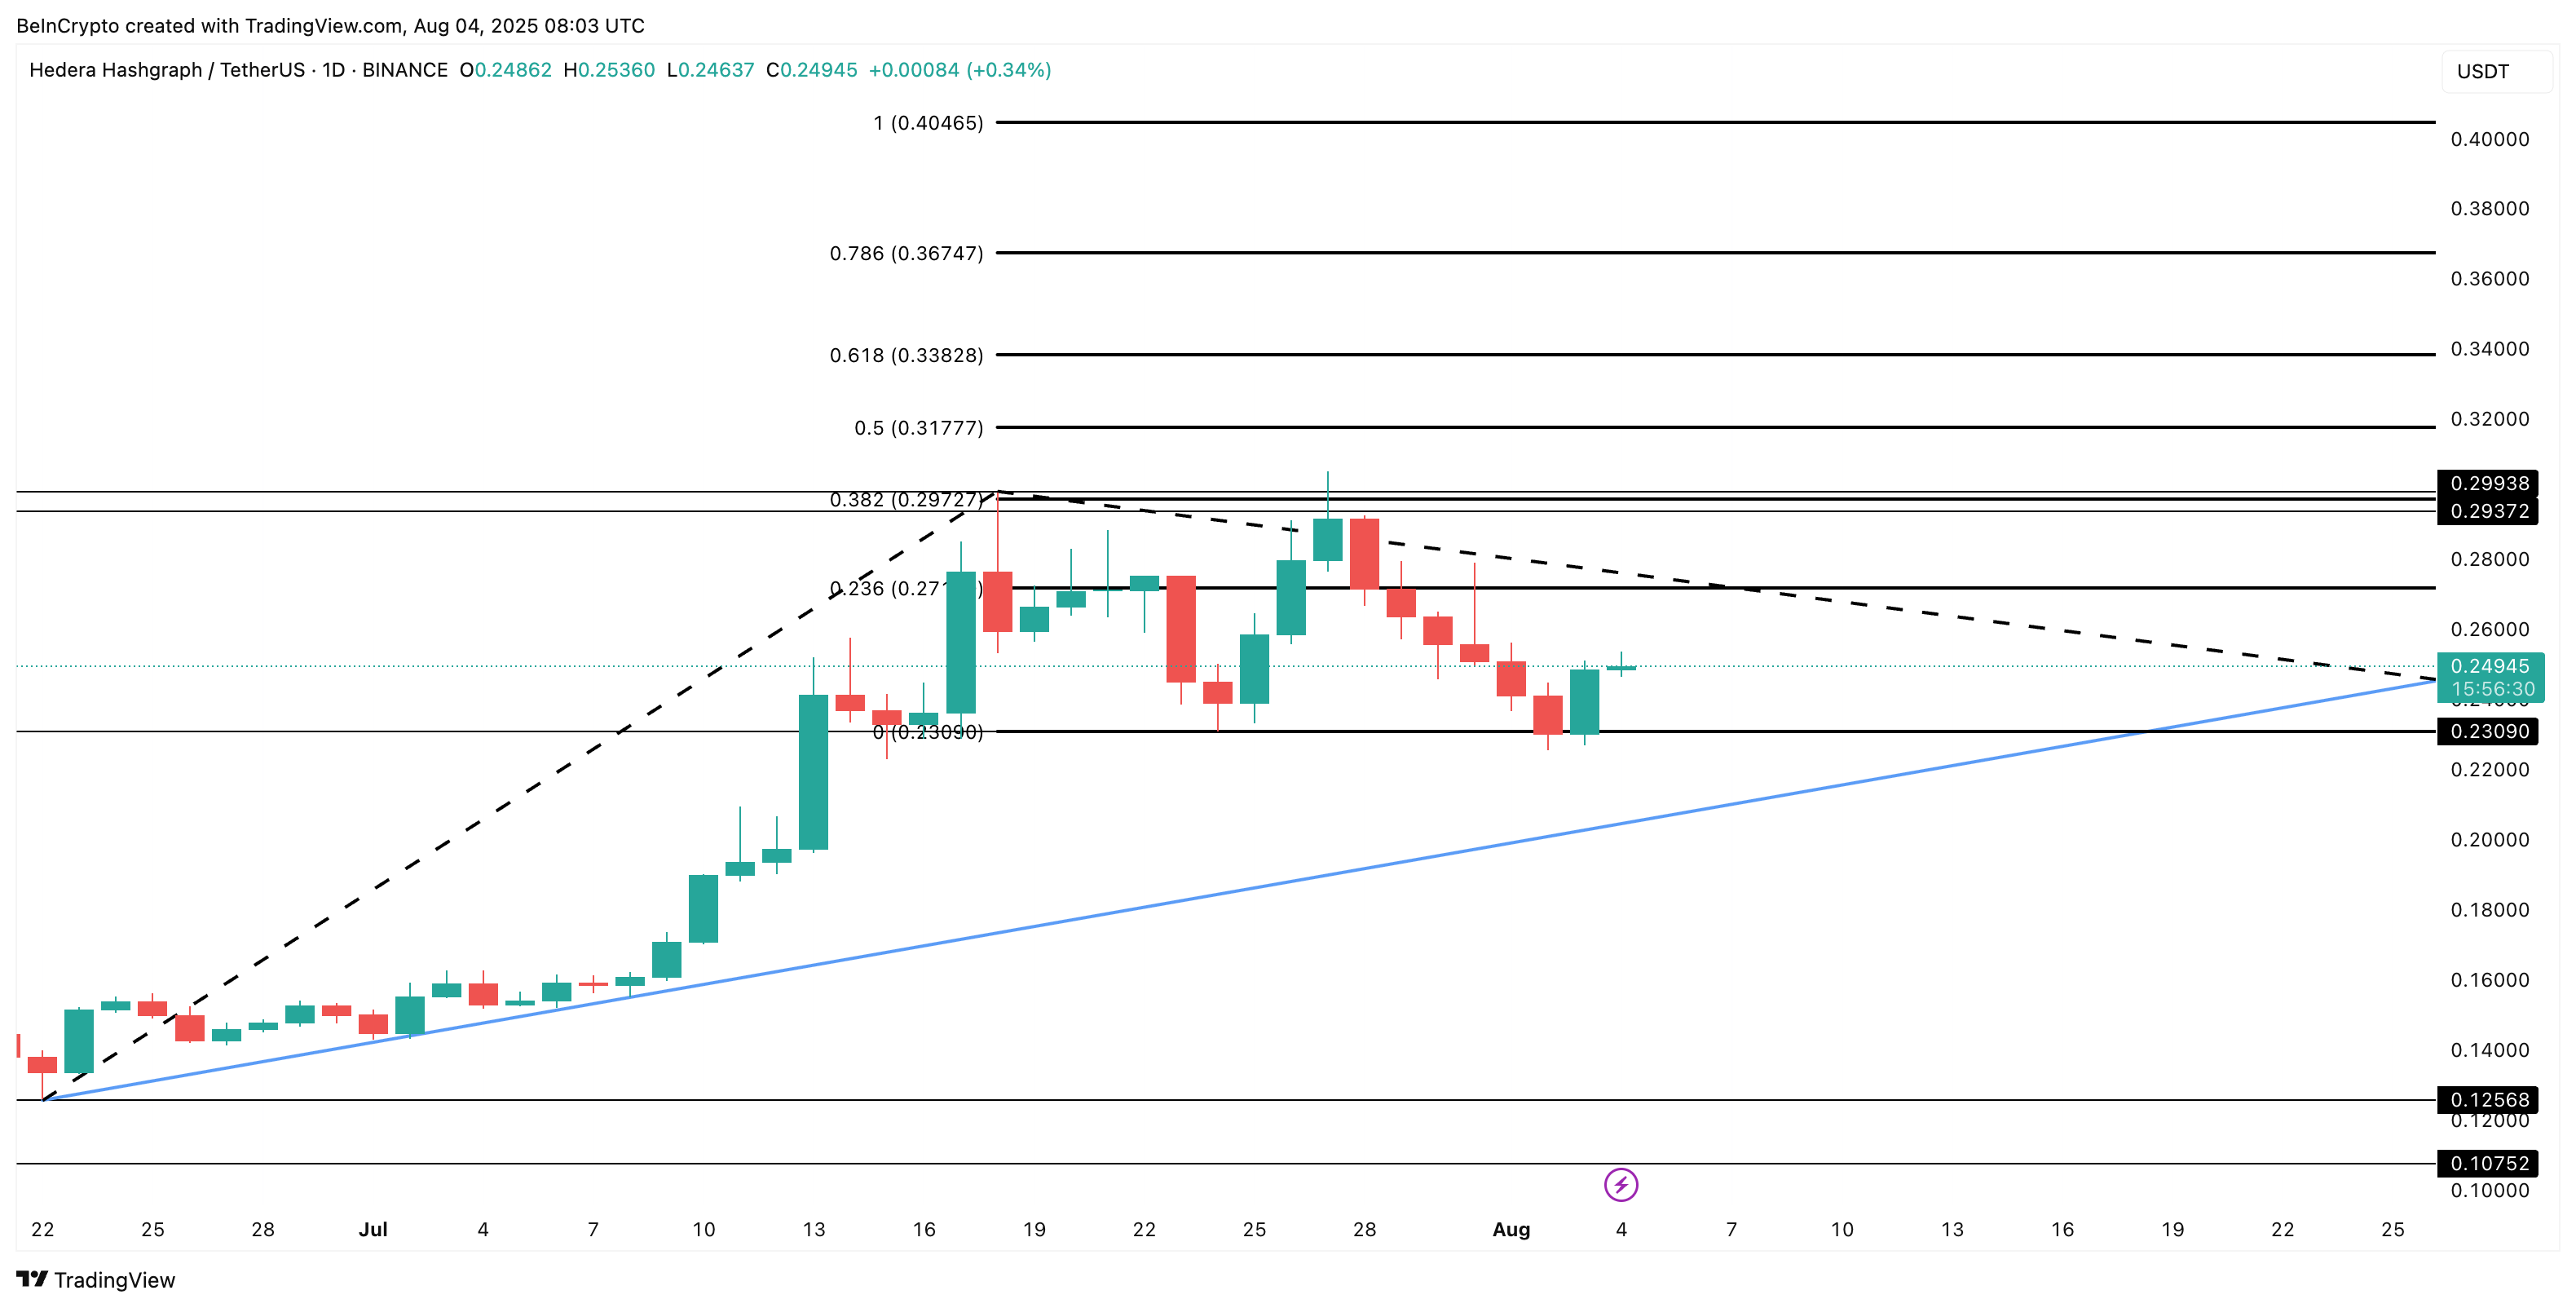
Trend-based Fibonacci extension is a tool used to identify potential future support and resistance levels by projecting price movements from previous trend swings.
If HBAR price breaks through $0.29, it could accelerate towards a new swing high. On the downside, falling below $0.23 would invalidate the short-term positive hypothesis, but as long as the HBAR price does not break out of the triangle's lower trendline, the overall structure will not turn negative.


