

Stellar ’s recent breakout is quickly fading, with XLM falling more than 6% over the past week and wiping out its short-term momentum.
Despite a 41% gain in three months, the trend suggests sellers are regaining control. Moreover, hopes for a recovery hinge on a fragile and unlikely market imbalance.
EMA Crossover Sends Clear Warning, Bearish Strength Is Increasing
On the 4-hour chart, the XLM price has now broken below all four EMAs – the 20, 50, 100, and 200-period exponential moving Medium . Most notably, a bearish EMA crossover has just formed, where the 50 EMA (orange line) has fallen below the 100 EMA (blue line).
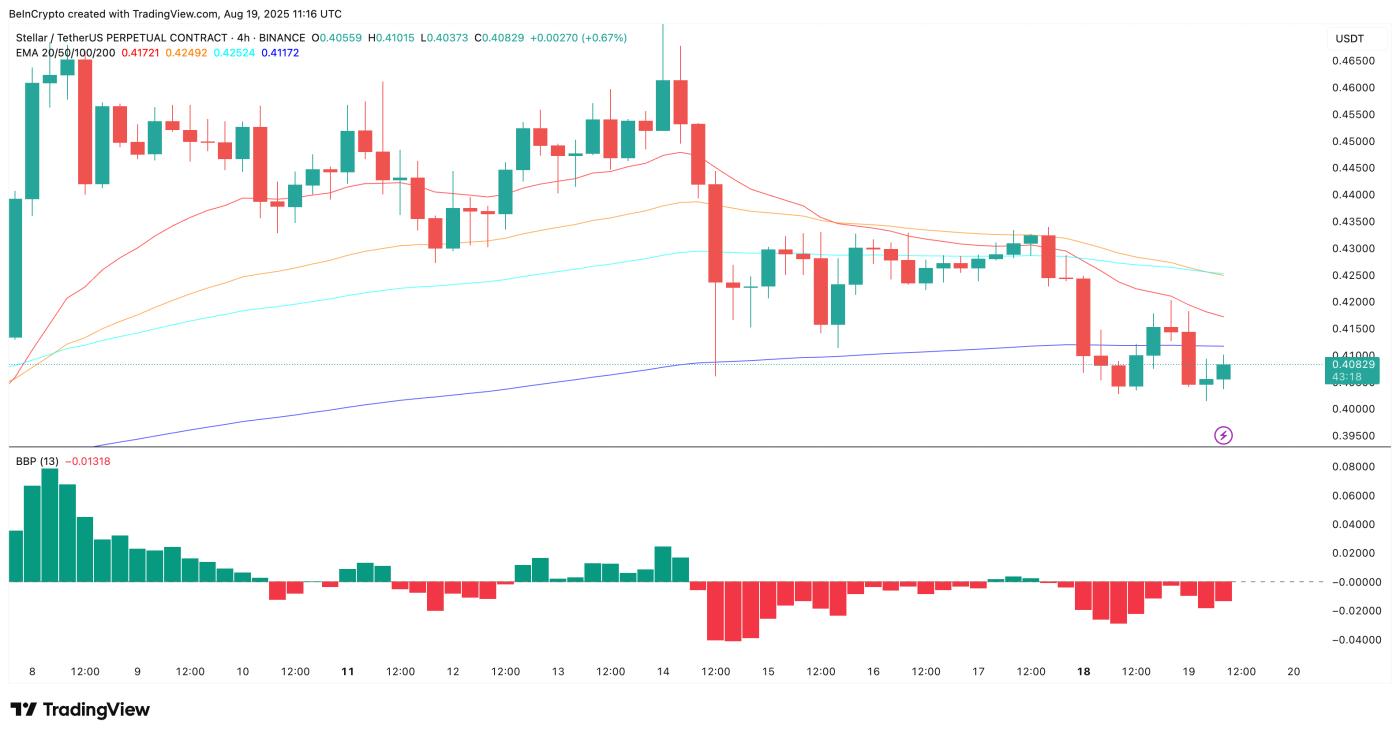 XLM Price and Bearish Cross: TradingView
This type of crossover, also known as a “Death Cross,” is known for triggering strong corrections.
Exponential moving Medium (EMAs) give more weight to recent price data to better capture momentum. When a short-term EMA crosses below a long-term EMA, it is considered a bearish signal, indicating that recent prices are falling faster than the long-term trend.
When short-term Medium like the 50 EMA fall below longer-term ones like the 100 EMA, it is often considered a momentum reversal, where buyers lose control and sellers begin to take over. But that’s not all.
The same chart also shows deep “red” in the Bull-Bear Power (BBP) indicator. This indicator compares recent highs and lows with a trend-following Medium to gauge the dominance of buyers or sellers. XLM ’s BBP is currently in negative territory, confirming that bears have taken control of the short-term price structure.
So far, price action shows weakness. But that's only half the story.
Liquidation map shows shorts are dominating, and that is the only hope
On Bitget, XLM has seen nearly $75.82 million in short liquidations and nearly $20 million in long liquidations over the past 7 days — highlighting a heavy bearish bias in trader positioning.
That is currently the only bullish view in XLM’s setup. If broader market momentum lifts the price even slightly, short positions could start to get squeezed, causing forced liquidations and pushing the price higher.
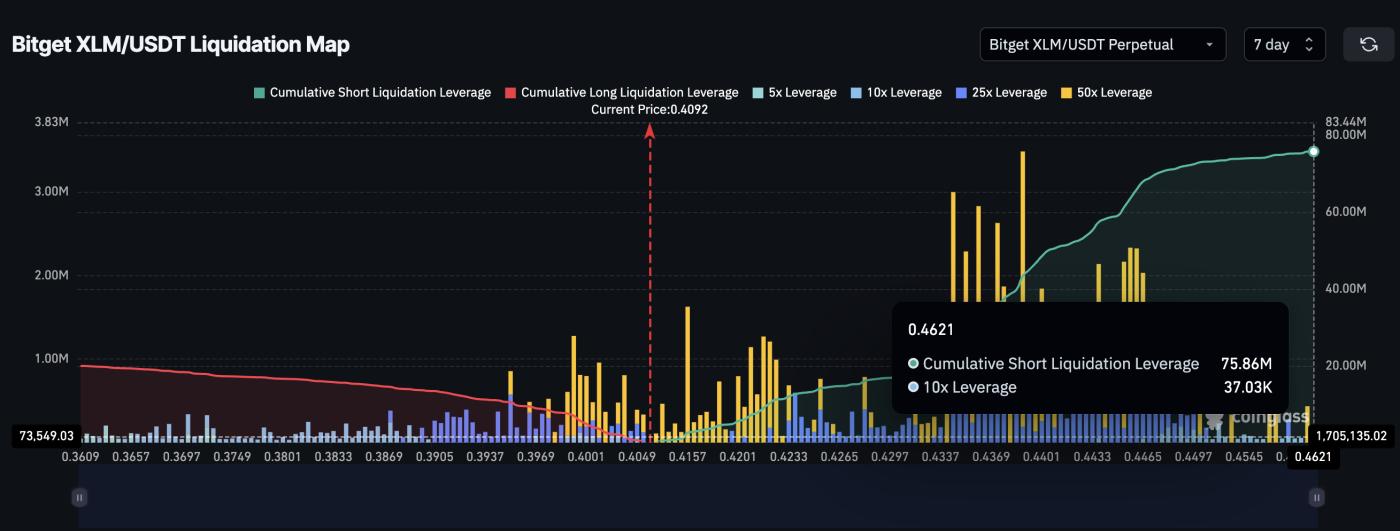 XLM Liquidation Map : Coinglass
A short squeeze occurs when too many traders bet on a price drop (opening short positions), but the price instead rises, forcing them to buy back quickly. This panic buying pushes the price higher, often dramatically.
XLM Price Pattern Broken, But Key Levels Still in Sight
XLM has clearly broken out of the recent pennant pattern on the daily chart. The immediate support level is currently at $0.40. If this level is broken completely, the bearish cross and BBP pressure could push the price down to $0.36 in the coming sessions.
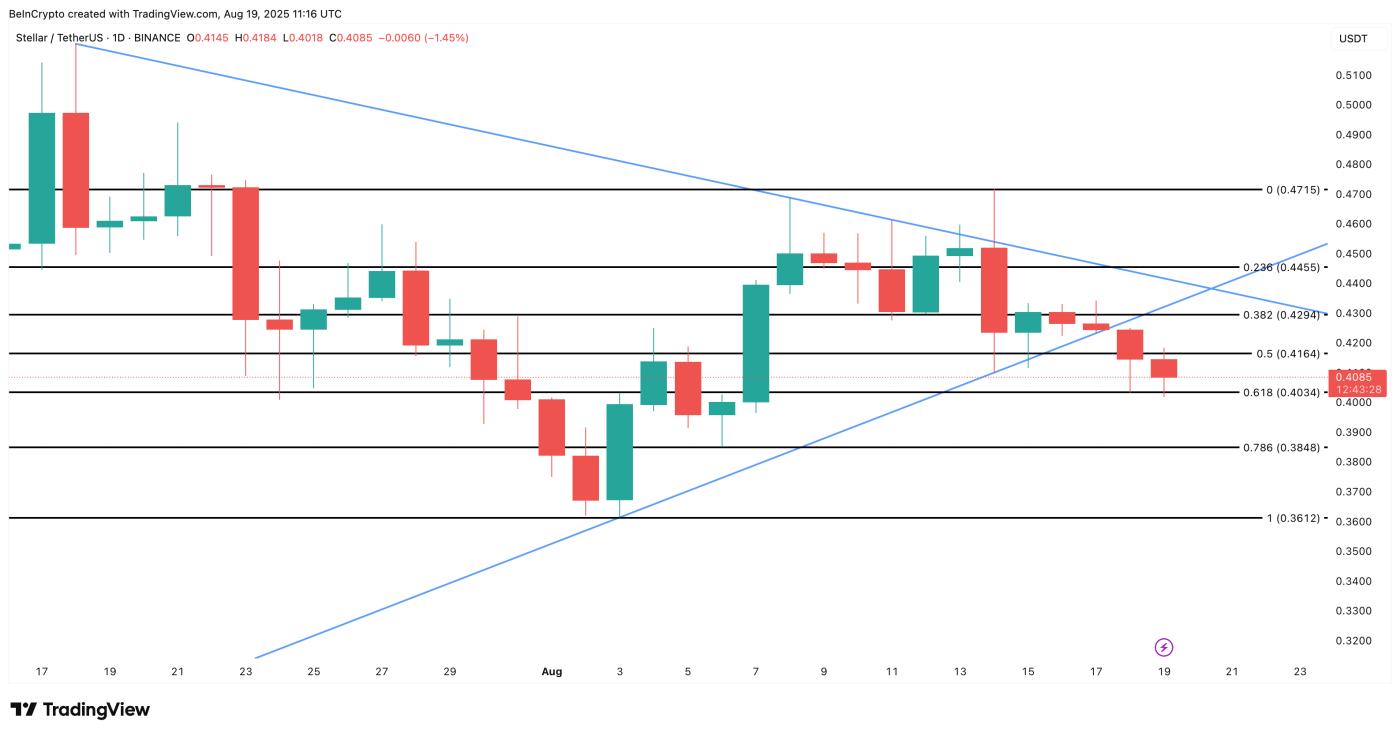 XLM Price Analysis : TradingView
However, if a short squeeze occurs, and XLM can reclaim the $0.42 to $0.44 zone, the short-term bearish structure will be invalidated. This will reverse the short-term sentiment and could trigger strong buying.
Until that happens, the bears remain firmly in control, with only an unusual imbalance providing any reason for hope.
About BingX Founded in 2018, BingX is one of the leading cryptocurrency exchanges with over 20 million users worldwide. BingX offers a variety of products and services such as: Spot trading, Futures Contract, copy trading, etc. to meet the needs of users of all levels. In addition, BingX exchange is proud to be the official partner of Chelsea FC. Download BingX Exchange app on iOS or Android now to start your investment journey! |


