

Bitcoin has fallen 12% from its all-time high, and online chatter is suggesting the bull run may be over. Consider the following points.
VX:TZ7971

Historical background reveals the norm:
Bitcoin’s current 12% pullback pales in comparison to the 20% to 40% declines that have frequently occurred in past bull cycles, suggesting this is just a regular fluctuation rather than a trend reversal.
Key support levels to watch:
Indicators such as the short-term holder realized price ($109,000) and moving averages (200-day moving average $101,000, annual moving average $93,000) will determine whether the bull trend continues.
Investor mentality changes:
Viewing pullbacks as accumulation opportunities can turn fear into strategy, especially for long-term holders.
No sign of surrender yet:
Indicators such as the realized output profit ratio (SOPR) are showing profits rather than losses, suggesting a persistent bullish structure.
Lessons from past cycles
It's crucial to compare the current market structure to past cycles. A useful comparison is the 2017 bull market, which also experienced a step-by-step rise before peaking. Here's what happened then:
A 20% correction is normal and occurs almost every month during an uptrend.
There have been 30% and even 40% pullbacks before the market continues higher. In 2017, there were multiple large 30-40% pullbacks before the market peaked.
While Bitcoin has grown into a larger, more institutionally recognized asset since 2017, volatility remains its inherent characteristic. In fact, we’ve witnessed multiple 20% to 30% pullbacks during this bull run.
From an individual perspective, such declines can be beneficial for net holders. Lower prices create opportunities to accumulate more Bitcoin at attractive levels, while rising prices expand overall wealth – for long-term holders, these short-term fluctuations are largely inconsequential.
When will it turn bearish? And key price levels
Currently, the market remains healthy as long as the structural bullish trend remains intact.
Short-term holder realized price
The Short-Term Holder (STH) Actual Buy Price measures the average purchase cost of Bitcoin by recent investors (more specifically, those who purchased Bitcoin within the past five months). It often acts as a psychological support level:
Current STH realized price: $109,000.
A price drop below this level could cause new investors to lose patience or panic sell.
The Deviation Multiple, or my Cost Band, visually demonstrates how far price has deviated from this key level.
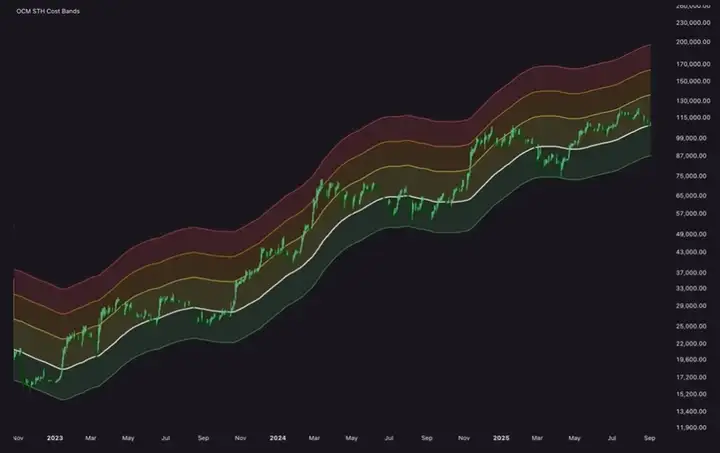
When price trades within the green cost band during this bull market, it provides us with the best risk-reward opportunity of this cycle.
The green cost band currently bottoms out at around $87,000 (interestingly, this corresponds to the 30% retracement of the all-time high), marking the highest risk/reward accumulation area. While the market may hover around this level for several months, further upward momentum usually emerges after the last wave of selling has ended.
200-day moving average
The 200-day moving average (MA) is a widely followed technical indicator that often represents long-term trend support.
Current 200-day moving average: $101,000.
A price test at this level suggests a pause in the trend, but does not necessarily mean a weakening market.
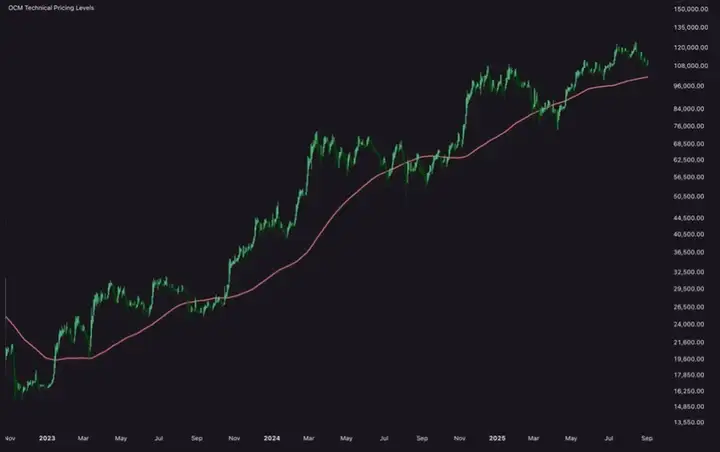
In both bull and bear markets, prices like to revisit this level as a test of trend continuation.
From a statistical perspective, prices tend to revert to the mean in a trending market. From a psychological perspective, this is a magnetic round number (with the attractive $100,000 figure nearby). A break below this level could exacerbate bearish sentiment, but holding this level maintains the bullish structure even if the market moves sideways.
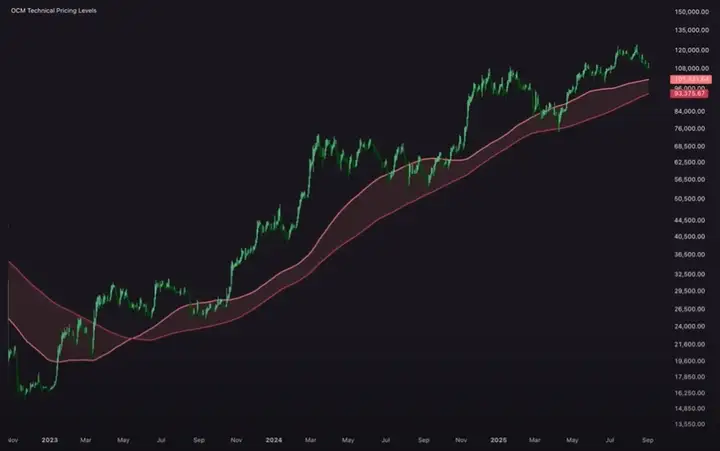
365-day moving average
To me, the annual moving average defines the line between a bull market and a bear market.
Current 365-day moving average: $93,000.
A breach here would trigger a reassessment of the broader market health, particularly investor spending behavior and herd selling dynamics.
Current Strategy and Mindset
Holding Bitcoin means taking the risk of price fluctuations.
Bitcoin's history shows that patience is more important than reactivity. Pullbacks of 20% to 40% are commonplace in every cycle. While they feel severe, they're merely blips in the grand scheme of things. A 12% drop amidst the online frenzy? That's understandable.
While a deep pullback is always a possibility, instead of worrying about it, it’s better to focus on key price levels:
STH realized price: Psychological support at $109,000
200-day moving average: Trend confirmation at $101,000
365-day moving average: Bull/bear dividing line at $93,000
Holding these positions will keep your bullish outlook intact, even as you experience fluctuations in market sentiment. Structurally, the bullish trend remains intact, and the overall market structure remains unchanged. Pullbacks are a normal part of the upward trend, and until there's evidence to the contrary, the trend is your friend.
Today's Fear Index is 55, rising to Greed status.
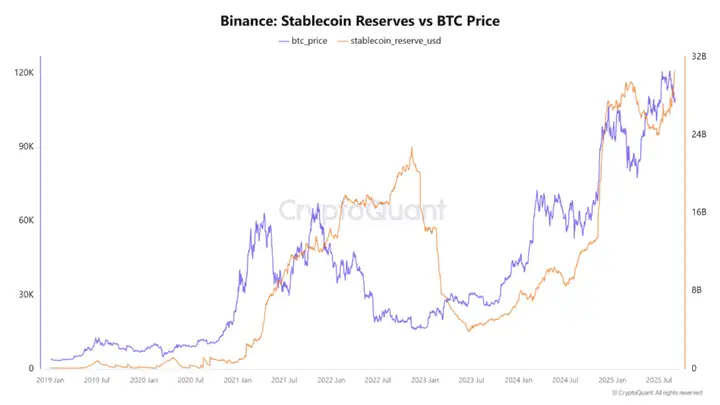
Despite the new highs in M2 and the increasing supply of stablecoins, Bitcoin's price has been in a steady downward trend since mid-August, falling from a high of $124,000 to around $107,000. This decline has not been accompanied by stablecoin liquidations, suggesting that market participants, both retail and institutional, are currently holding cash and waiting for entry opportunities rather than purchasing immediately.
The data doesn't indicate market weakness, but rather a calculated wait-and-see approach. Liquidity is in place and ready to enter the market, but the market is still waiting for a spark. If this liquidity is activated, BTC will continue to reach new highs.


