

With the surge in the prices of multiple Binance Alpha tokens, discussions about the altcoin season led by Binance Alpha have once again become popular.
Many users on social media are discussing what logic represents the potential secret to wealth. However, this so-called altcoin season is actually just a cognitive bias caused by a few "runaway" projects. But if we want to identify commonalities among these secrets to wealth, among the many Binance Alpha tokens, what qualities are capable of leading the market?
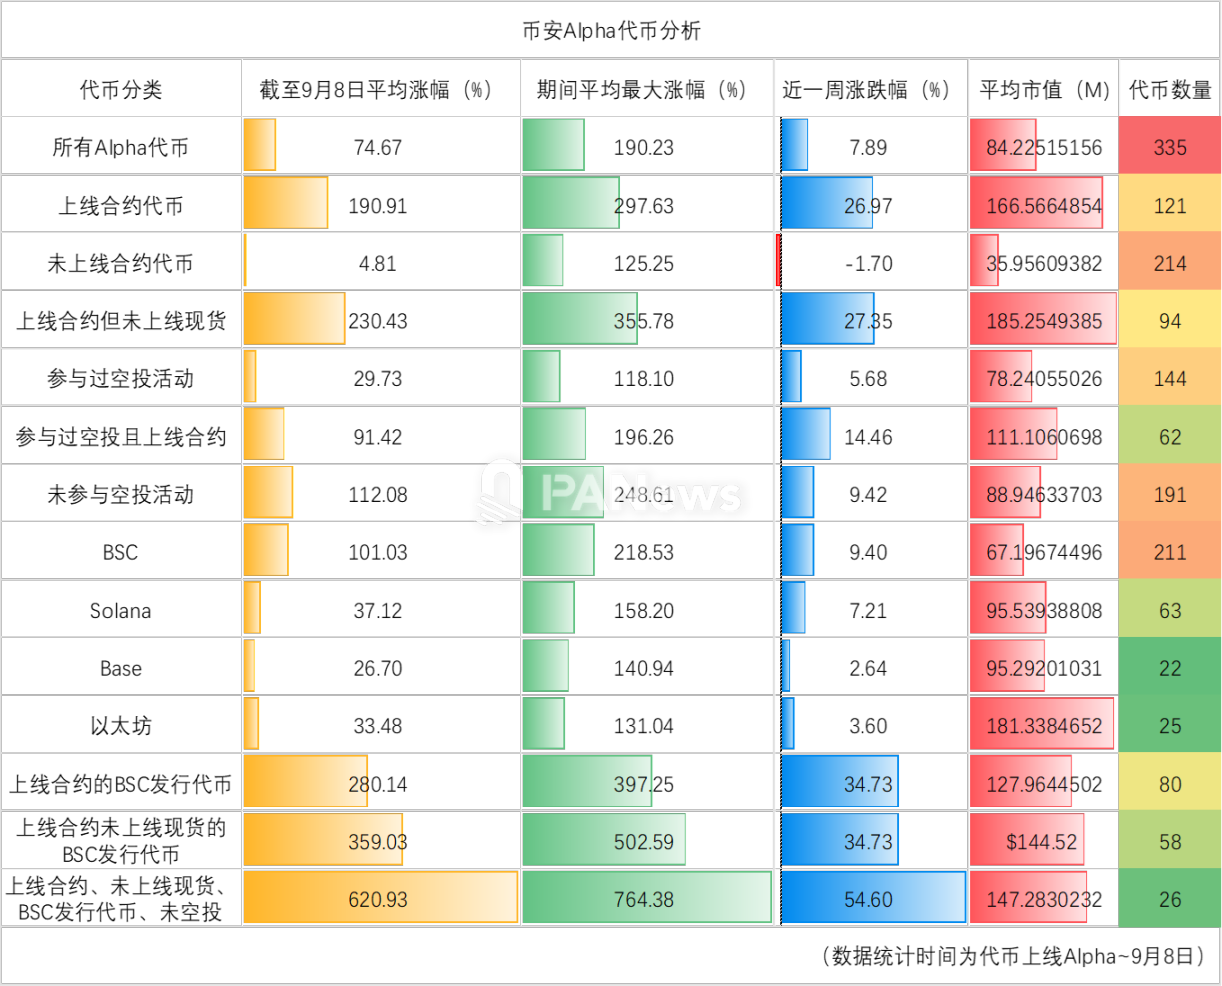
PANews conducted a comprehensive data analysis of the 335 tokens listed on Binance Alpha, digging deep into the true wealth code behind them from multiple dimensions such as market capitalization, chain distribution, trading pair type, and whether there is an airdrop, and explored the ultimate question: Is the so-called Binance Alpha "altcoin season" really here?
The altcoin season may be an illusion. Only five tokens have seen their value more than double in the past week.
According to PANews ' analysis of the 335 tokens listed on Binance Alpha, their market performance showed two core characteristics: a general "listing pull-up effect" and a huge "performance polarization."
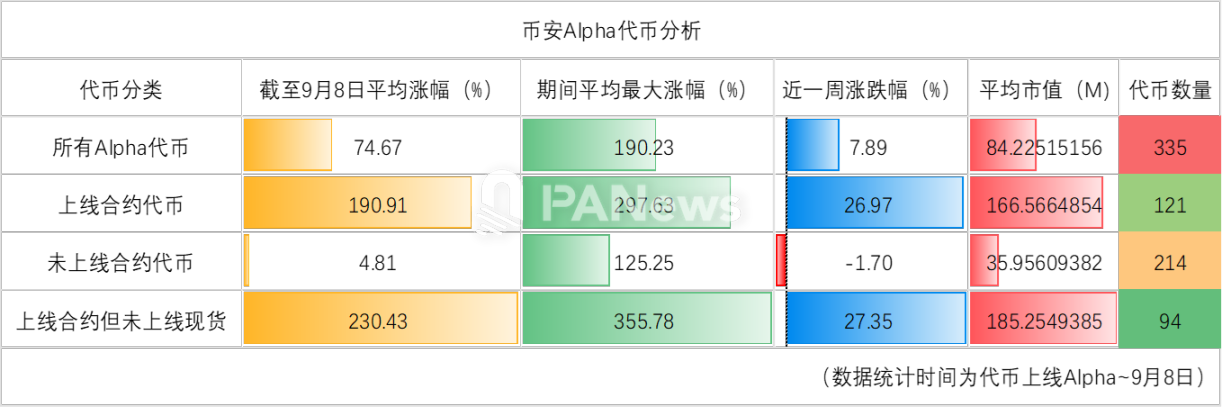
A widespread bullish effect: The average price increase for these tokens since listing is 74.6%, with the historical average maximum price increase reaching 190%. This indicates that the vast majority of tokens experienced a strong bullish trend after listing on the Alpha platform. Specifically, 120 tokens (35%) saw their prices double at their peak post-listing, while only 19 tokens never broke through their issue price.
Polarized Performance: However, long-term performance after the rally has varied significantly. To date, while 146 tokens (43.5%) have seen gains, 44 of which have doubled, with the star project MYX achieving an astonishing 123x return, 81 tokens (24%) have seen their prices halved, with the largest drop exceeding 97%.
Market Capitalization Distribution: In terms of project size, the average market capitalization of these tokens is $84.22 million, with a median of $18.58 million. The largest number of projects (48) have a market capitalization exceeding $100 million, followed by projects with a market capitalization between $10 million and $20 million. This demonstrates that while there are smaller projects with a total market capitalization below $1 million, the mainstream projects on the Alpha platform still possess considerable scale.
Data from the past week: 141 tokens saw gains over the past week, with MYX still seeing the largest increase, reaching 1064% over the past seven days. However, only five tokens saw increases exceeding 100% in the past week. Statistically, the average weekly increase or decrease for Binance Alpha tokens was only 7.8%, far less than the average increase or decrease over the entire trading cycle. Therefore, the recent surge in alt-season on Binance Alpha may simply be a cognitive bias, not a universal phenomenon.
Will the price increase be greater if you trade in contracts instead of spot prices?
In addition, one of the topics discussed a lot on social media is that tokens listed on Binance Futures but not on spot trading may see greater gains.
First, overall, only 28 tokens currently have spot trading pairs listed on Binance, representing only 8.3% of the total. The vast majority of these also have futures trading pairs. However, a relatively large number, 121 tokens, represent 36% of the total. 94 tokens have only futures trading pairs listed, but not spot trading pairs. These tokens have seen an average seven-day increase of 27%, exceeding the overall average for all tokens. In comparison, tokens without futures trading pairs have seen an average increase of -1.7%, indicating an overall decline over the past week.
In terms of market capitalization, the average market capitalization of tokens not listed on futures contracts is around $35.96 million, while the average market capitalization of tokens listed on futures contracts is approximately $160 million. Clearly, tokens with higher market capitalizations are more likely to be listed on futures contracts. Looking at the entire cycle, the average increase in the value of tokens listed on futures contracts has reached 190% to date, with the highest historical increase reaching an average of 297%, demonstrating significantly better performance. Tokens listed on spot trading have only seen an average increase of 45.77% to date (this refers to performance after the Alpha release).
In comparison, the average increase for tokens listed on contracts but not on spot trading reached 230%, and the average maximum increase reached 355%. Tokens that met this condition did perform better.
BSC chain has obvious local advantages, with an average increase of more than double
Are there different effects in terms of the chain?
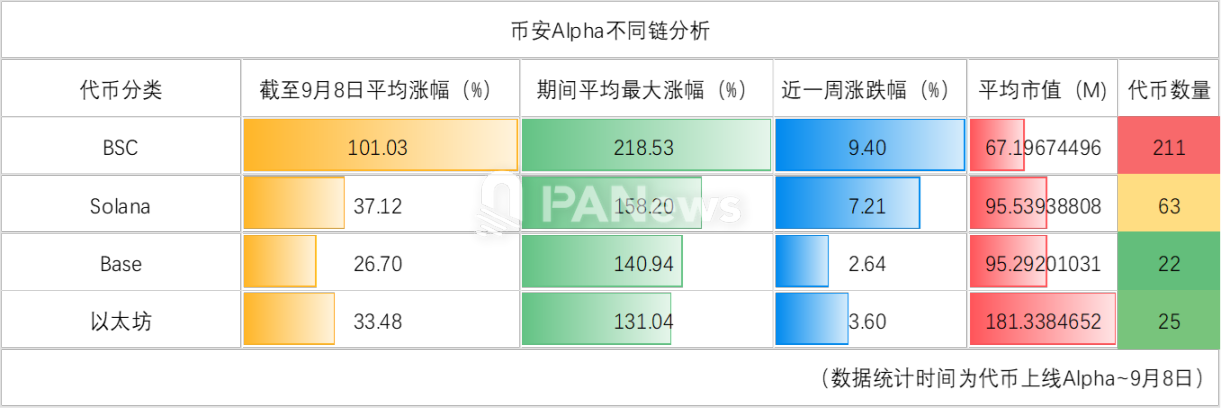
From the distribution of chains, among the tokens currently online, there are 22 on the Base chain, with an average increase of 26%; there are 211 tokens on the BSC chain, with an average increase of 101%; there are 28 tokens on the Ethereum chain, with an average increase of about 33.4%; there are 64 tokens on the Solana chain, with an average increase of about 37%.
Judging from the distribution of chains, BSC, as a native public chain, is indeed more favored by the market and its market performance is better than tokens of other public chains.
Buy old, not new; popular tokens are generally listed earlier
What are the characteristics of the tokens that have seen the largest recent gains?
1. Tokens on the BSC chain dominate. Among the five tokens that have increased by more than 100% in the past week, four are from the BSC chain and one is issued on the Solana chain.
2. The launch time is not for newly launched tokens. These tokens are generally launched in May and July, with only one being launched on August 24.
3. There are 3 tokens listed for contract trading pairs, but this does not seem to indicate a direct relationship between the price increase being greater than the listing of contract trading.
4. Market capitalization distribution is not statistically significant. The market capitalizations of these five tokens range from hundreds of thousands of dollars to billions of dollars. However, the market capitalizations of four tokens are all over $10 million.
If we take a longer-term view and analyze the tokens that have increased by more than 100% since their launch, it may be more useful for reference.
1. In terms of market capitalization, the market capitalization of these tokens generally exceeds 10 million US dollars, and the tokens with a market capitalization of more than 100 million US dollars generally rank higher in terms of growth.
2. The number of online contracts accounts for 54.5%. From this point of view, this does not seem to directly prove that the high increase is necessarily related to the online contract trading.
3. Tokens issued on the BSC chain account for 56%, and those issued on Solana account for 22.7%. The combined share of these two chains is nearly 80%.
4. There are significant differences in the time of Binance Alpha launches. The launch distribution is as follows: April (12), May (4), June (3), July (16), August (6), and September (3). This data clearly shows that tokens launched in April, July, and August have better market performance.
Is issuing airdrops actually not conducive to raising token prices?
Another area of market concern is the performance of the tokens that participated in the Binance Alpha airdrop. PANews' investigation revealed that 144 tokens have been airdropped by Alpha. The average price increase of these tokens to date is approximately 29%, which is actually lower than the overall performance of Alpha tokens. Of these, 91 tokens have experienced price declines since listing on Alpha, with the largest drop reaching 97%. However, in terms of maximum price increases, these tokens all experienced a surge in price after listing on Alpha, with an average maximum increase of approximately 1235%. However, observing the data here, we can see that REX's maximum increase since listing reached 1457 times, which was caused by a short-term abnormal candlestick pattern. Excluding this abnormal data, the average maximum increase is approximately 118%.
However, when the data is filtered to include tokens that have participated in airdrops and are listed on Binance Futures, the average increase in these tokens reaches 91%, with the average maximum increase reaching 196%. This performance is better than the average for airdrop tokens, but lower than the average for futures tokens.
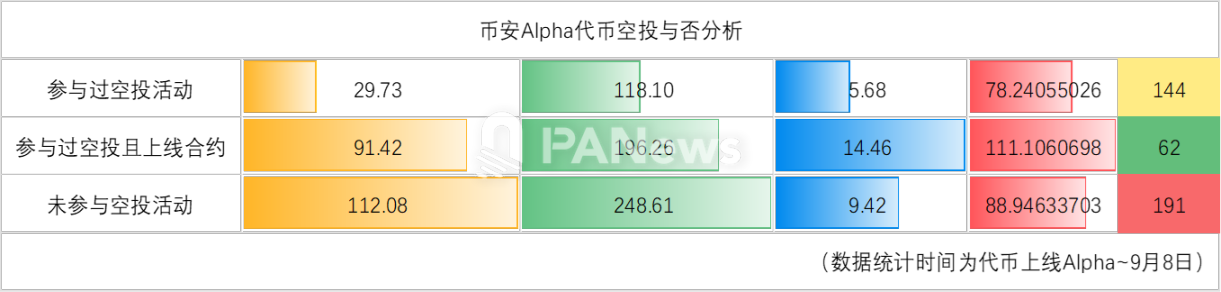
From this perspective, whether or not Binance Alpha Token is listed on futures trading becomes one of the most critical positive factors for the project. Conversely, participating in airdrops has little impact on the project's market price and may even have a negative impact.
Optimal combination: Contract listing, no spot listing, BSC chain, no airdrop
So, returning to our ultimate question, what tokens are likely to perform best within Binance Alpha? Combining this with our previous analysis, we can identify several potential favorable factors from multiple perspectives: listing on contract trading, being issued on the BSC chain, not having airdropped, and not being listed for spot trading.
After combining several conditions, the average increase for tokens issued on the BSC chain and listed for contract trading has reached 280%, exceeding that of tokens listed only for contract trading. Adding the filter for tokens not listed for spot trading, the average increase reaches 359%. The strongest filter, consisting of tokens listed for contract trading, not listed for spot trading, not airdropped, and issued on the BSC chain, shows an average increase of 620%, with the maximum average increase reaching 764%. The increase in the past week was 54%, representing an optimal performance across all dimensions.
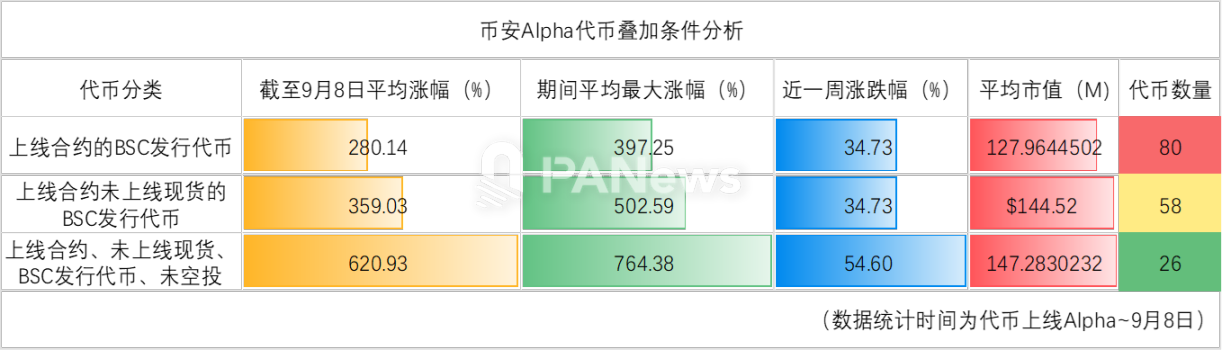
At this point, we seem to have found the secret to identifying promising stocks on Binance Alpha, and only 26 tokens were selected based on these criteria. A closer look reveals that the most crucial factors in this process are contract trading and issuance on the BSC chain, while the other factors are more like supporting factors. However, what's striking is that these supporting factors aren't due to any additional activities of these projects or tokens, but rather to the lack of spot trading and airdrops.
Fundamentally, the underlying logic behind this may be that airdropped tokens flood the market with low-priced chips, creating a market crash. The fact that these tokens are only available for contract trading, rather than spot trading, means that their price volatility is relatively low. While rising prices are always a positive development for spot investors, for those who prefer contract trading, these tokens also experience greater volatility, making them more susceptible to short squeezes.
However, it's worth noting that the above research is based on historical data, which may be subject to overfitting. Furthermore, a significant drawback is the failure to categorize these tokens and provide more specific project information, which could be even more crucial. Therefore, these conclusions shouldn't be relied upon as a basis for actual investment decisions. We hope this research serves only as a starting point for methodological guidance, offering readers a new perspective.
The current opportunity isn't the early stages of a bull market where you can profit by blindly buying in. Instead, it's a structural market that requires careful selection and in-depth analysis. For investors, understanding the logic behind this phenomenon is far more important than simply chasing hot spots. In this highly volatile market dominated by contract trading, the flip side of opportunity is always a risk that requires vigilance.


