

Ethereum is trading above $4,540 at the time of writing on September 12, 2023, up nearly 3% over the past 24 hours. Weekly gains are close to 4.7%, while monthly changes remain negligible at -1.9%. However, the breakout that occurred on September 10 has brought Ethereum back into the spotlight.
The breakout from the currently active Falling Wedge pattern suggests further upside, with on chain and Derivative data showing two powerful groups backing the move. Together, their actions point to a potential run to $5,110 if conditions persist.
Retail investors retreat while Derivative traders surge
Ethereum’s rally was marked by a sharp decline in the Spent Coins Age Band (SCAB). On September 4, the number of coins moving across all age bands reached 417,000 ETH. By September 12, that number had dropped to just 148,000 ETH (a 64.5% decrease), despite a temporary spike to 365,000 ETH on September 11.
This drop or cooling of the spot market is notable because recent highs in ETH prices, such as August 14 and August 27, saw the number of coins consumed surpass 500,000 ETH.
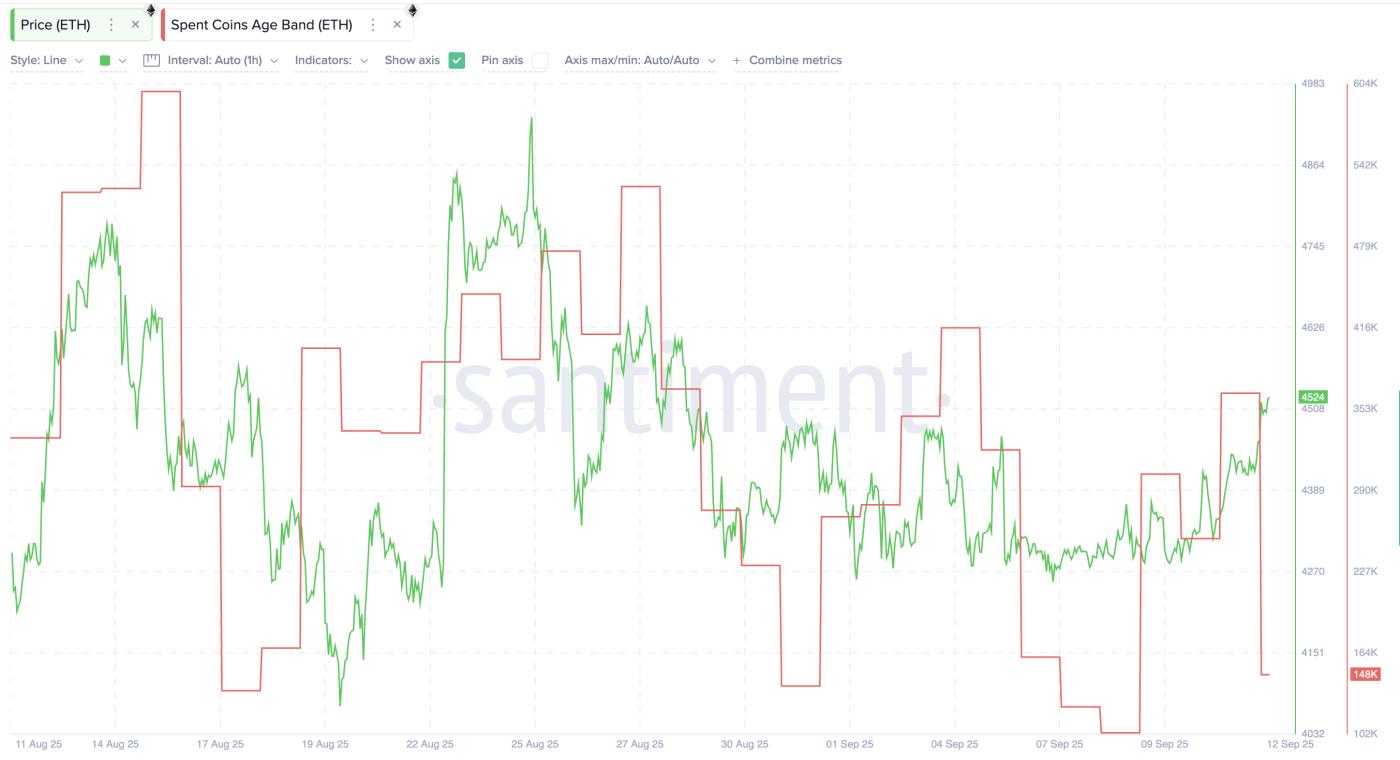 Ethereum Spot Market Cools Down: Santiment
In other words, previous rallies in the summer saw a sharp sell-off of older coins. Now, the opposite is happening. The drop in the number of coins burned suggests that investors — even long-term ETH holders — are not selling during this rally. This adds credence to the breakout, as fewer coins are being released to the market.
The Spent Coins Age Band (SCAB) index tracks the distribution of coins moving by age. It reveals whether old supply is pressuring the market.
Want more information on Token like this? Sign up for Editor Harsh Notariya's daily Crypto Newsletter here .
At the same time, Derivative activity has surged. The Taker Bid/Sell Ratio has crossed 1.0, indicating that buyers are dominating the Order Book by absorbing sell orders. The ratio began rising on September 10, just as Ethereum broke out of a Falling Wedge pattern (which we will discuss later in the article), and peaked at 1.17, its highest level in over a year.
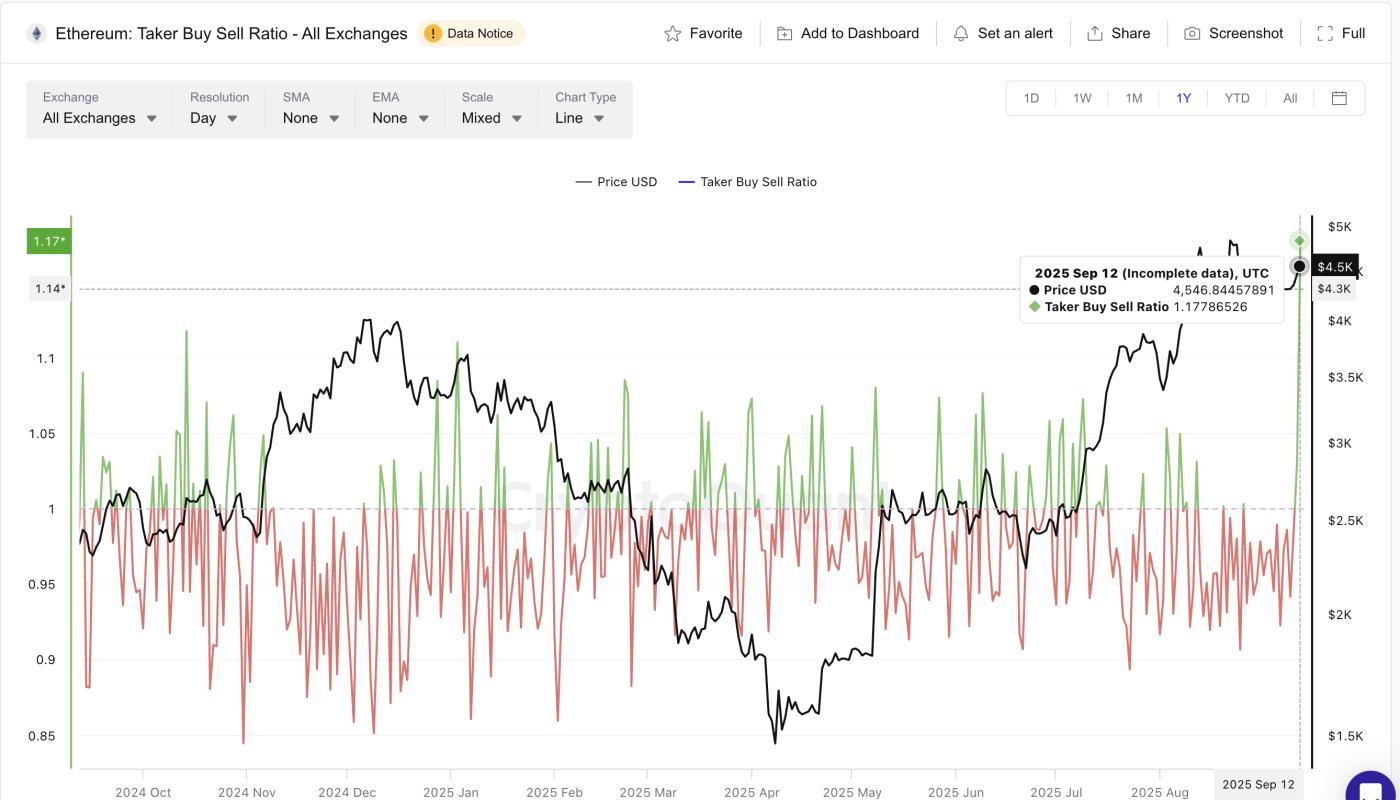 Ethereum Derivative Traders Take Long Bets: CryptoQuant
Such spikes typically indicate strong buying pressure. For comparison, one of the most recent major surges occurred on August 3, when the ratio spiked and Ethereum rose from $3,490 to $4,750, a gain of nearly 36%. While these surges typically cool off later in the day, the current reading highlights strong speculative demand from Derivative traders.
The combination is powerful: spot investors are showing confidence by not selling, and Derivative traders are pouring in with bullish bets. Together, these two groups create a supportive foundation for Ethereum's breakout.
Falling Falling Wedge Pattern Breakout Indicates Ethereum Price Could Hit $5,100
Ethereum's technical structure also supports this bullish setup. On September 10, ETH confirmed a breakout from a Falling Wedge pattern — a pattern in which the price forms lower highs and lower Dip within narrowing lines, eventually breaking out to the upside.
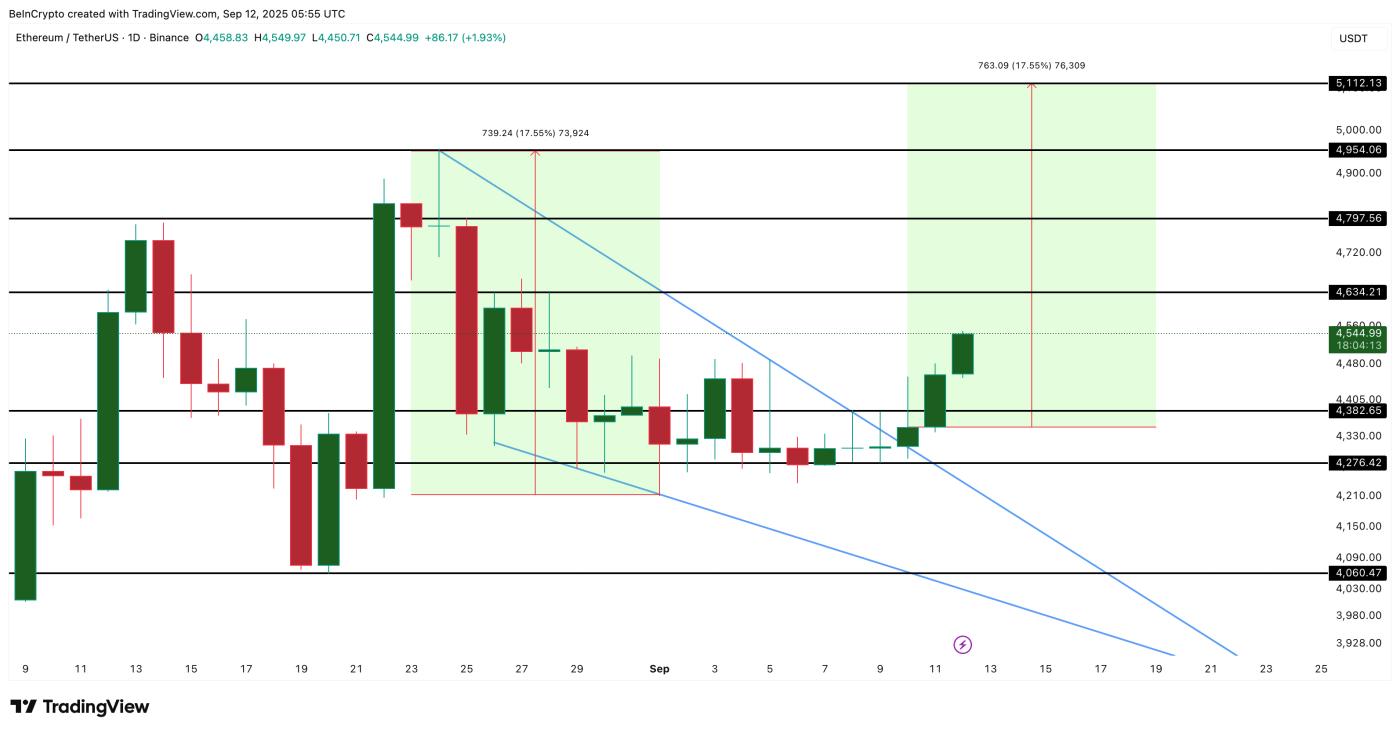 Ethereum Price Analysis: TradingView
The target for this move is measured by taking the vertical distance between the highest and lowest points of the wedge. That distance is then projected from the breakout level. This gives a target of $5,110, or nearly 12% above current levels, if market conditions permit.
Ethereum price has to overcome a few resistance levels first. The first is at $4,630, followed by $4,790 and the previous Ethereum price high near $4,950.
On the downside, $4,380 is immediate support. However, a drop below $4,279 would completely invalidate the Falling Wedge breakout and bring ETH back to a neutral outlook. And the situation would turn negative if the price drops below $4,060, which does not look likely in the short term.


