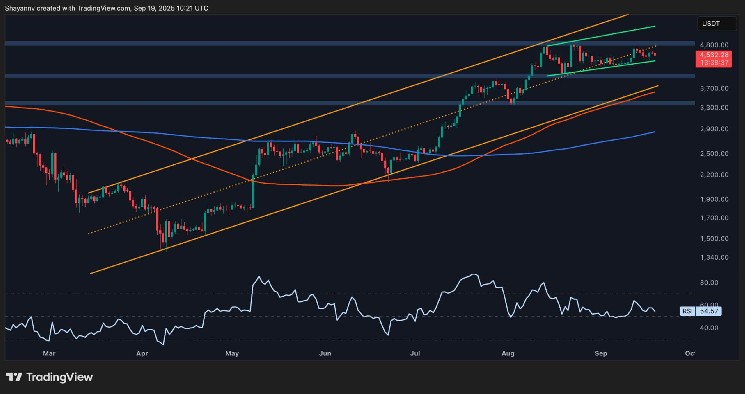
Ethereum’s price has been consolidating for over a month now and is yet to push through the key $5,000 mark. This consolidation has come following a significant rally since April, pushing the asset past multiple resistance levels, and will likely continue if the market is able to break through the $4,800 level in the coming weeks.
Technical Analysis
By Shayan
The Daily Chart
The daily chart shows a clear overview of ETH’s uptrend inside a large ascending channel since April this year, with the price reclaiming several key levels, including the 100-day and 200-day moving averages, which are now located around $3,700 and $2,900 marks, respectively.
Currently, the asset is rising gradually within a tight ascending channel, which is also located around the midline of the larger channel. If the smaller channel is broken down, the market will likely revisit the $4,000 level. On the other hand, if the market bounces higher and breaks above the $4,800 resistance zone, a historical rally toward $5,000 and higher would be expected.
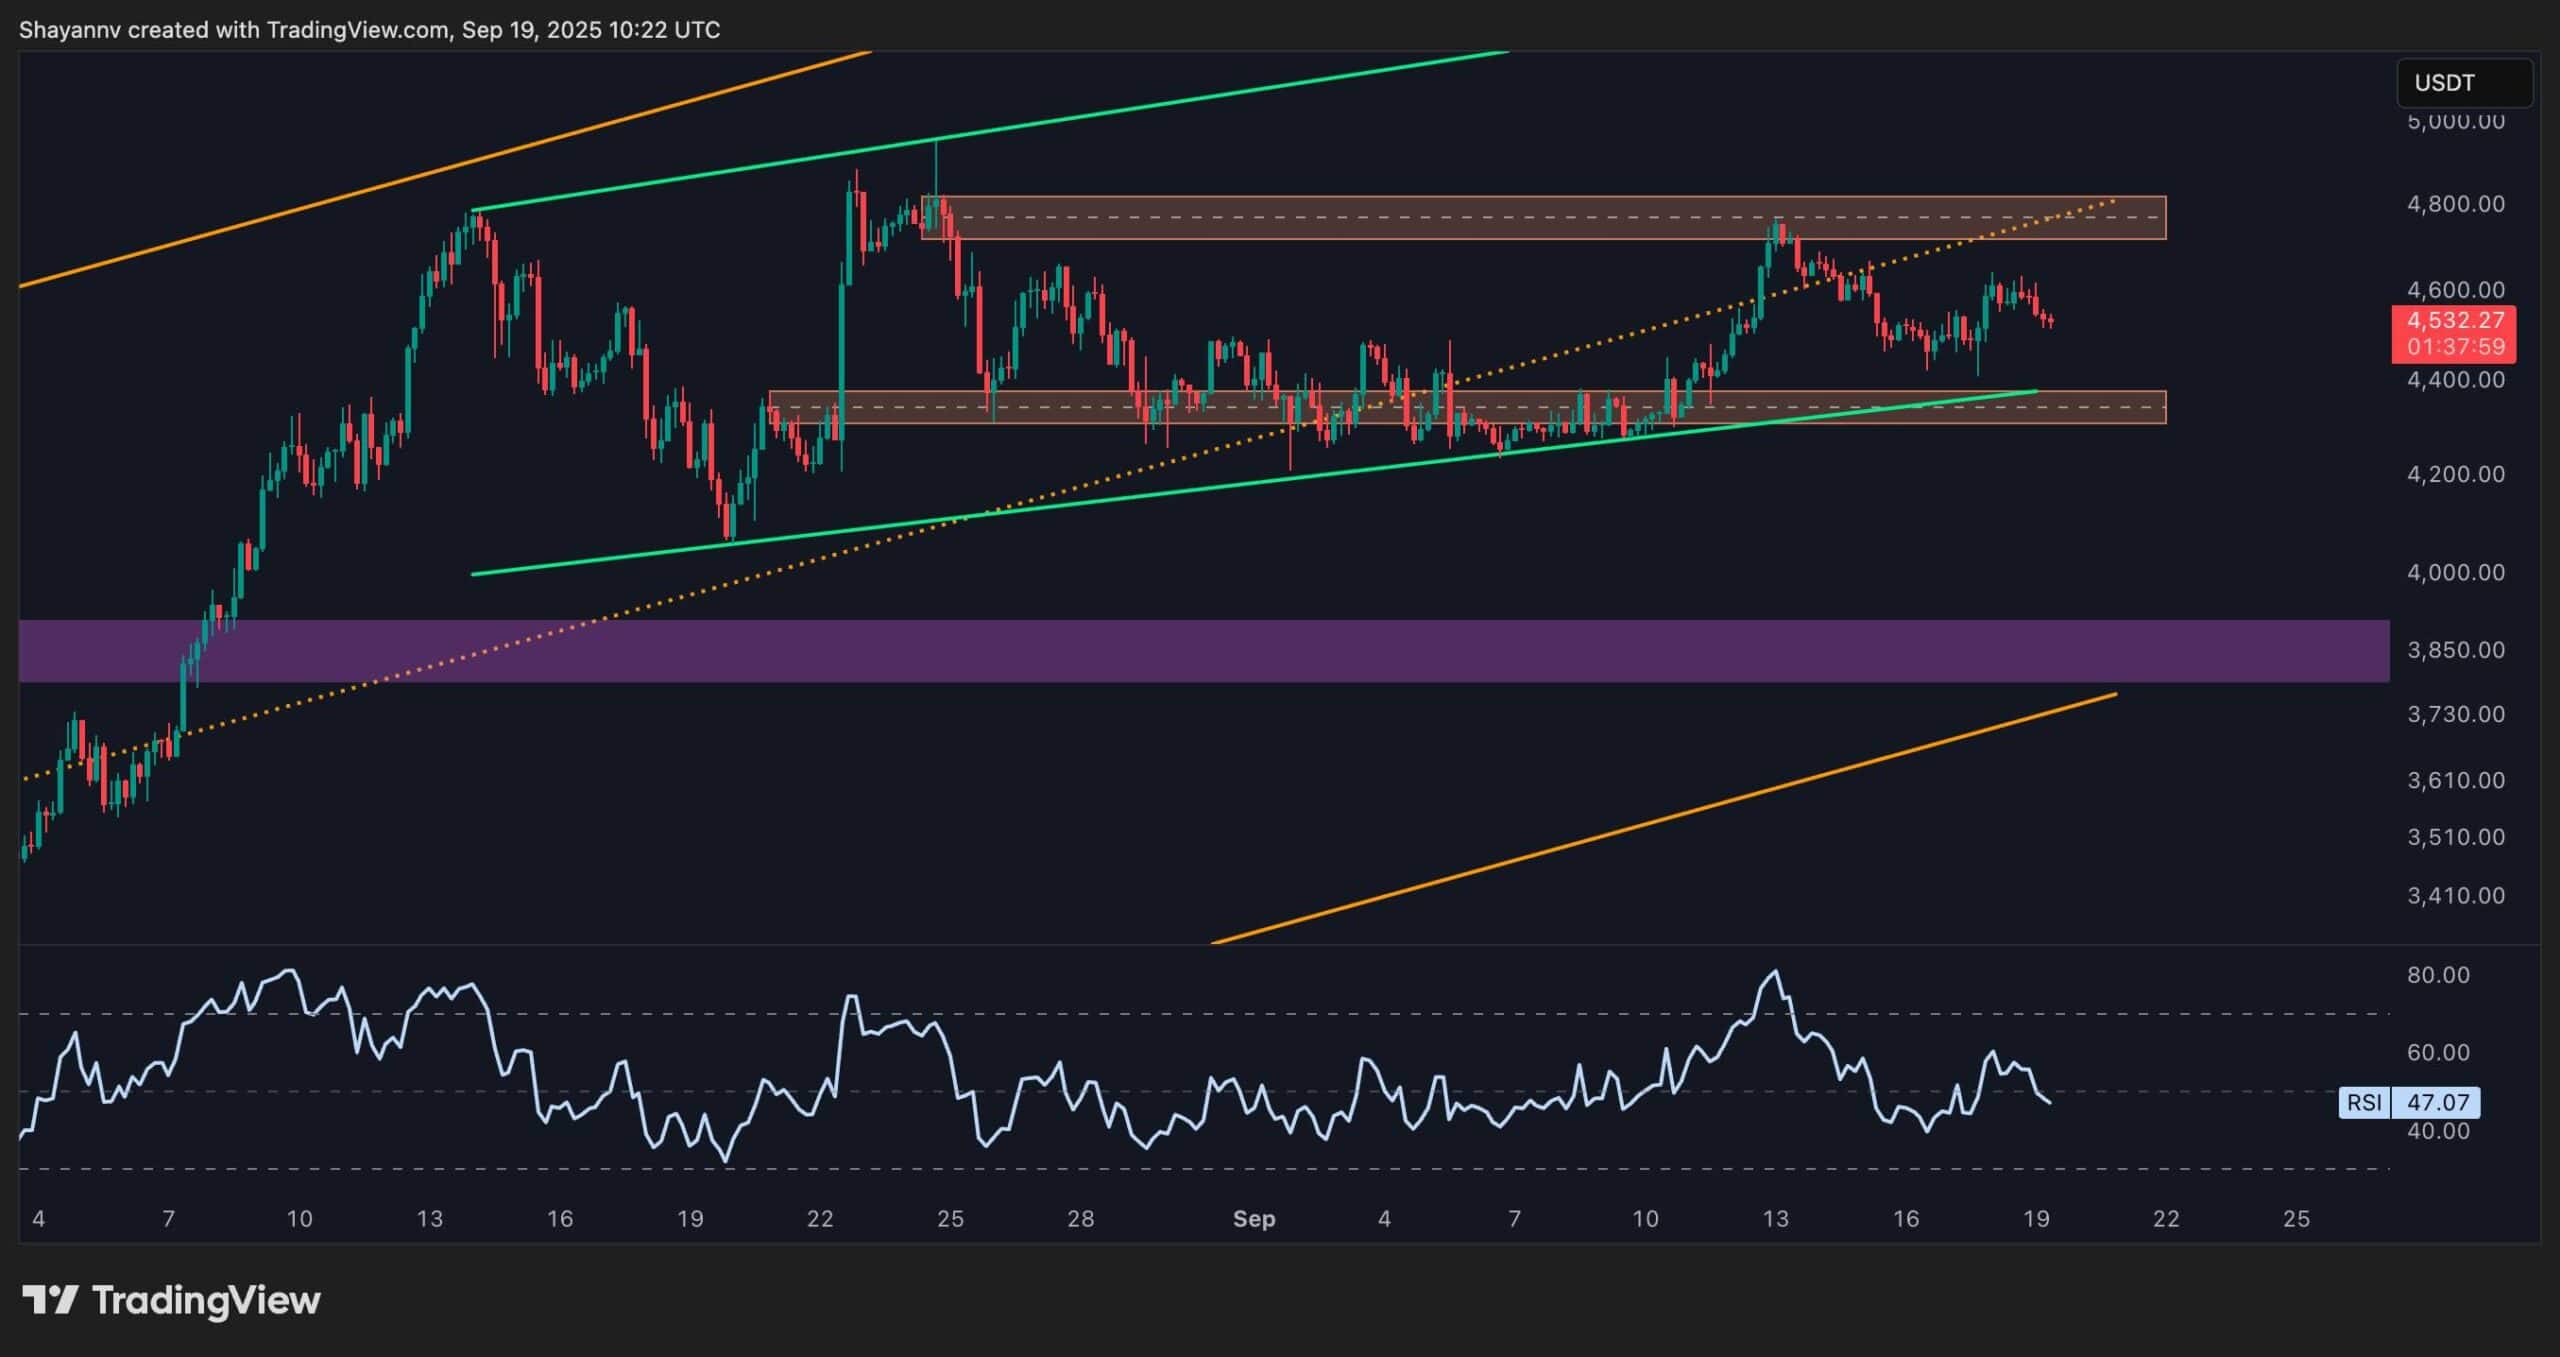
The 4-Hour Chart
Dropping down to the 4-hour timeframe, it becomes clear that the recent consolidation has been mainly bounded inside a range between the $4,300 demand zone and the $4,800 supply zone.
With the lower trendline of the green ascending channel also closing in on the price, the time for the market to make a decision is near. A breakdown of the channel and the demand zone would lead to a retest of the $3,850 demand zone and the lower boundary of the larger ascending channel, while a rebound from this zone would likely push the price past the $4,800 supply area and into the vicinity of the key $5,000 level.
Onchain Analysis
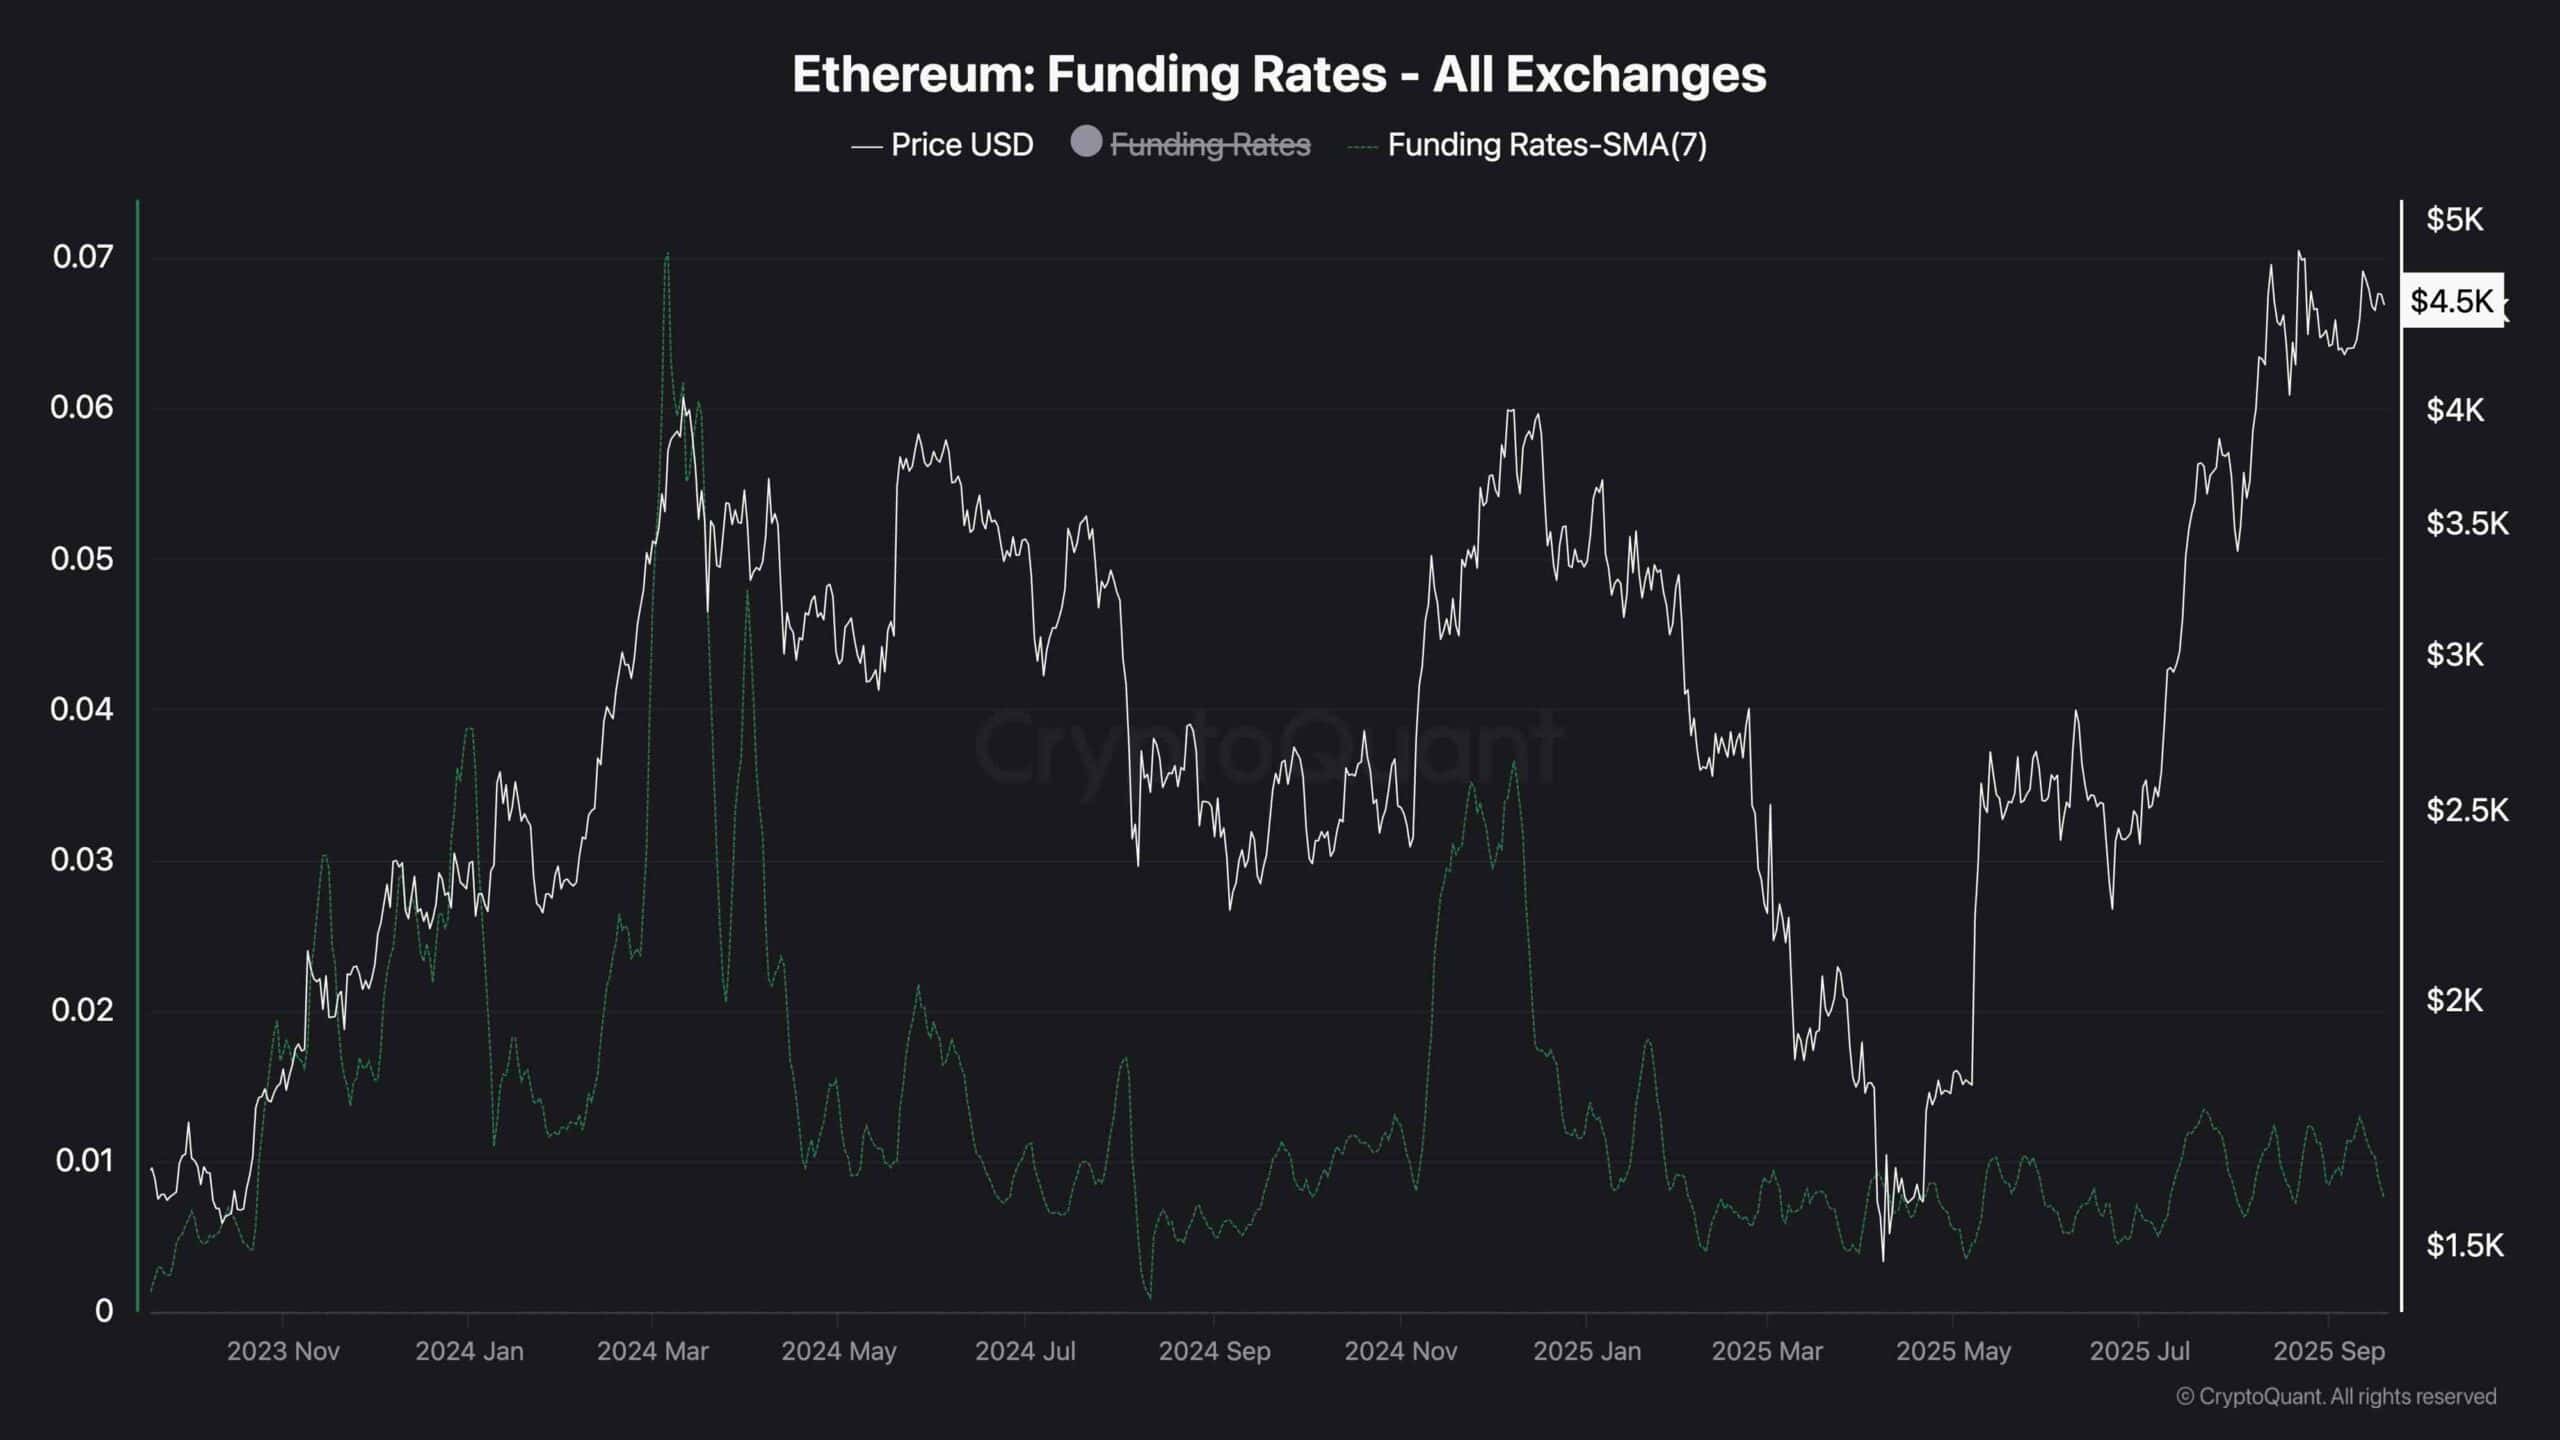
Finding Rates (7-day moving average)
Moving away from technical analysis, this chart presents the 7-day moving average of Etheremu’s funding rates. The funding rates metric measures how aggressive the buyers and the sellers are in the futures market, with positive values indicating more aggressive position-taking by the buyers.
As evident from the chart, the 7-day moving average of the funding rates has shown positive values for quite a long while now. Yet, these values are not comparable to the peaks witnessed in March 2024 and late 2024, when the price also reached long-term highs.
This can be an indication that the market still has room to grow, as the futures market is yet to become significantly overheated. However, caution is still advised because positive funding rates can always lead to liquidation cascades.