

PI Network's PI Token has remained in a sideways trend after falling to a new All-Time-Low of $0.1842 on September 22, 2023.
Since then, the cryptocurrency has been fluctuating within a horizontal channel, finding support at $0.2565 while facing resistance at $0.2917. With bearish clouds looming over the broader market, PI is at risk of revisiting its lows.
Weak motivation puts PI under pressure
The falling Average True Range (ATR) reading on PI reflects weakening momentum among retail investors in the spot market. Readings from the PI/USD one-day chart show that the indicator has been steadily declining since the sideways trend began on September 23, 2023, to reach 0.0234 at the time of writing.
Want more information on Token like this? Sign up for Editor Harsh Notariya's daily Crypto Newsletter here .
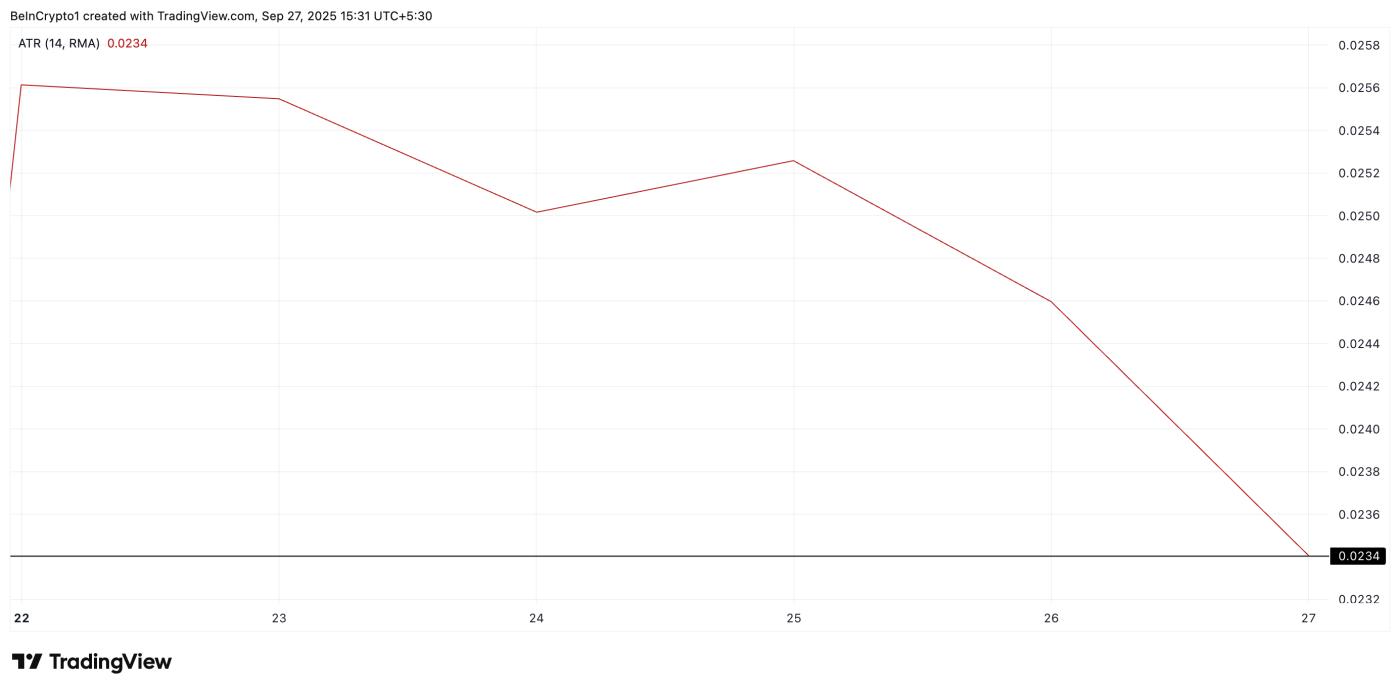 PI Average True Range. Source: TradingView
ATR measures price volatility over a given period of time. When it trends downward like this, it usually indicates that price volatility is narrowing and overall momentum is weakening.
This decline highlights the declining participation of traders in the spot market and the lack of new Capital inflows into the Token, suggesting a possible break of support at $0.2565 in the near term.
Furthermore, PI is trading firmly below its 20-day Exponential Moving Average (EMA), confirming this bearish outlook. At the time of writing, this important moving Medium is creating dynamic resistance above PI’s price at $0.3185.
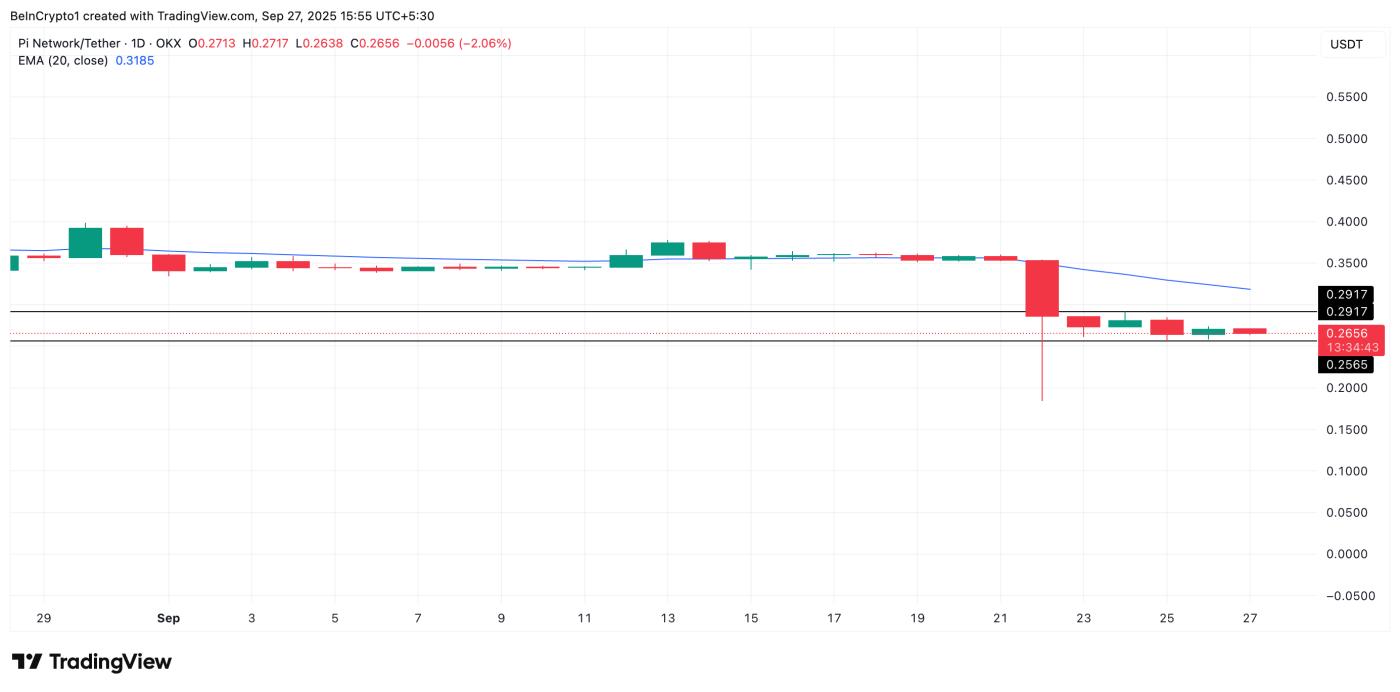 PI 20-Day EMA. Source: TradingView
The 20-day EMA measures the Medium price of an asset over the last 20 trading days, giving priority to recent prices. When the price falls below it, sellers are in control and market momentum is tilted to the downside.
This suggests that PI is struggling to attract bullish momentum and could extend the sideways trend, or even face fresh bearish pressure if sentiment does not improve.
Downside risks continue to increase
With the trading momentum weakening, PI's price action is increasingly vulnerable to another breakdown. It could push below the $0.2565 support and revisit the All-Time-Low.
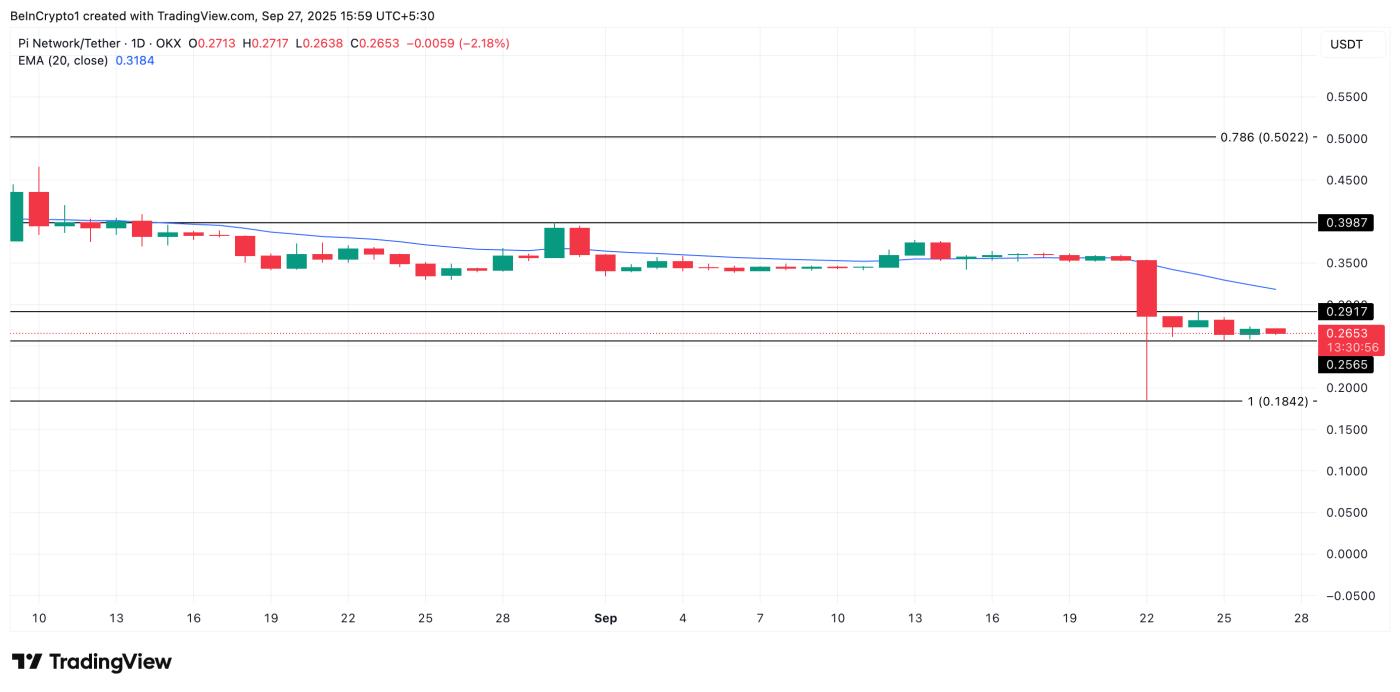 PI Price Analysis. Source: TradingView
Conversely, if sentiment improves, PI could attempt to clear the resistance at $0.2919. A breakout above this level could mark the start of a recovery attempt, pushing PI’s price above its 20-day EMA.


