

Top altcoin Ethereum moved sideways in early September as the market attempted to recover from a sharp correction in August. However, bears took over on September 12 and have since pushed ETH into a downtrend. ETH is trading at $4,113 at the time of writing, down nearly 15% since then.
With the general sentiment deteriorating, user demand dropping on the Ethereum network, and institutional investors pulling out, the coin is facing a tough time in October.
ETH supply increases as demand decreases
on-chain data shows that Ethereum's circulating supply has increased sharply over the past month. According to data from Ultrasoundmoney, 76,488.71 ETH were added to the number of coins available to the public.
To stay updated on TA and the Token market: Want more information on Token like this? Sign up for Editor Harsh Notariya's daily Crypto Newsletter here .
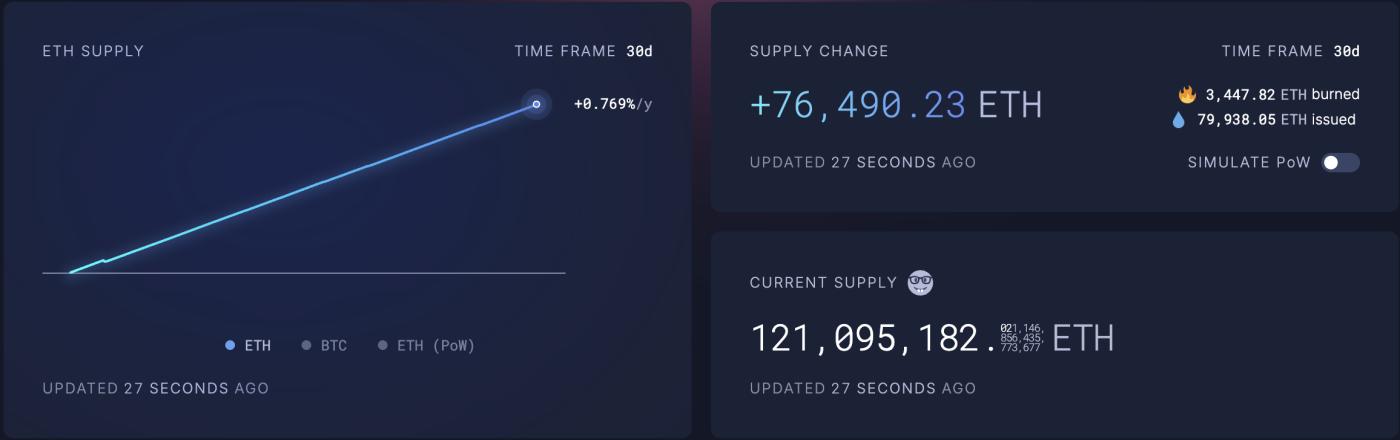 Change in ETH circulating supply. Source: Ultrasoundmoney
Ethereum's circulating supply increases as user activity decreases, as this reduces the burn rate on the Layer-1 blockchain.
Typically, as more users transact and interact with Ethereum, the burn rate (a measure of how many ETH Token are permanently removed from circulation) increases, contributing to Ether's deflationary supply dynamics.
However, with the decline in user activity on the network, the burn rate also dropped sharply, leaving more coins in circulation and increasing its circulating supply.
With ETH facing a bearish trend and no corresponding demand to absorb the increasing supply, the bearish pressure on ETH is even stronger.
Spot ETH ETF records strong outflows
The decline in institutional interest in ETH also points to a bearish outlook heading into October. According to Sosovalue, outflows from ETH focused funds reached $389 million this month, the largest monthly Capital since March.
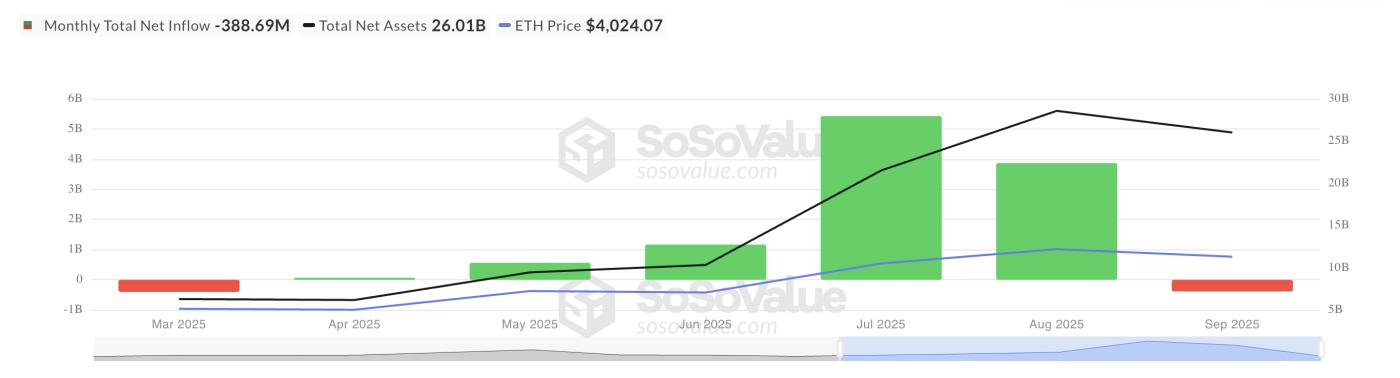 Ethereum Spot ETF Net Inflow. Source: SosoValue
This is important because ETH prices are strongly correlated with ETF inflows. So when these inflows decline, it signals a decline in confidence among institutional investors. If this trend continues unabated, it could impact the coin’s price performance in the coming weeks.
The lack of institutional interest could also impact retail investor participation. Without the confidence and liquidation that large investors bring, retail investors may refuse to participate or commit Capital, worsening ETH 's performance in the coming weeks.
Weak spot demand threatens $4,000 support
A reading from the ETH/USD one-day chart confirms that spot market participation is also weakening. Its On-Balance Volume (OBV) indicator has been trending down since September 12, signaling a decrease in buying demand.
OBV tracks cumulative volume by adding volume on up days and subtracting it on down days. When OBV is rising, buyers are pushing prices higher with strong volume support.
Conversely, a falling OBV like ETH 's shows that selling pressure outweighs buying activity. This increases the downside risk for ETH in the coming month.
If the buying pressure continues to decrease, the altcoin could fall below $4,000 and drop to $3,875.
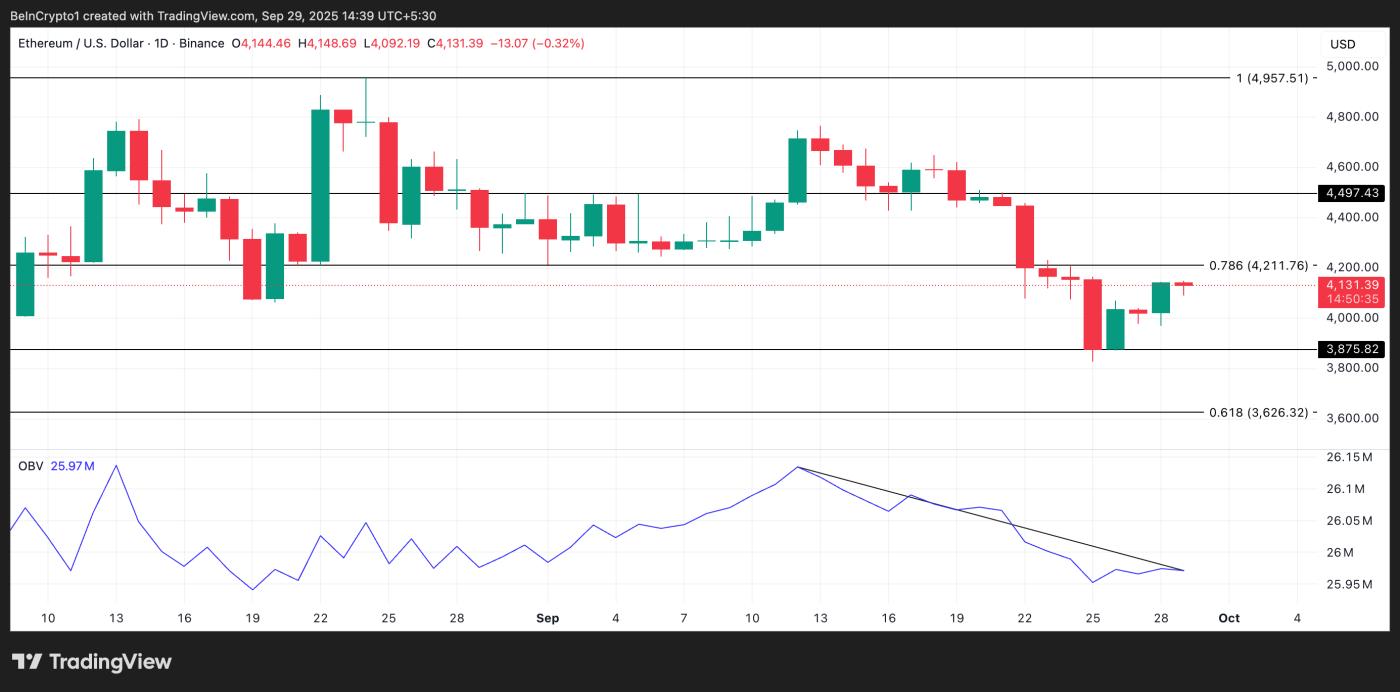 ETH Price Analysis. Source: TradingView
On the other hand, if sentiment improves and demand picks up, ETH price could regain strength, break above the resistance at $4,211, and climb to $4,497.


