

In 2017, Stellar (XLM) had a spectacular price increase, from just a few cents to a peak of $0.93. This growth has brought huge profits to investors. By 2025, some signals suggest that XLM may be preparing to repeat that performance in Q4.
What are those signals and how can they affect the market? Here is a detailed analysis.
1. Stellar network activity hits yearly high
Stellar network activity, as measured by the Stellar Operations index, has reached its highest level in the past year, according to data from Artemis.
“Stellar Operations” refers to individual actions performed on the Stellar network, such as transferring funds, trading on a decentralized exchange (DEX), or executing smart contracts. These actions represent real network usage, independent of price fluctuations.
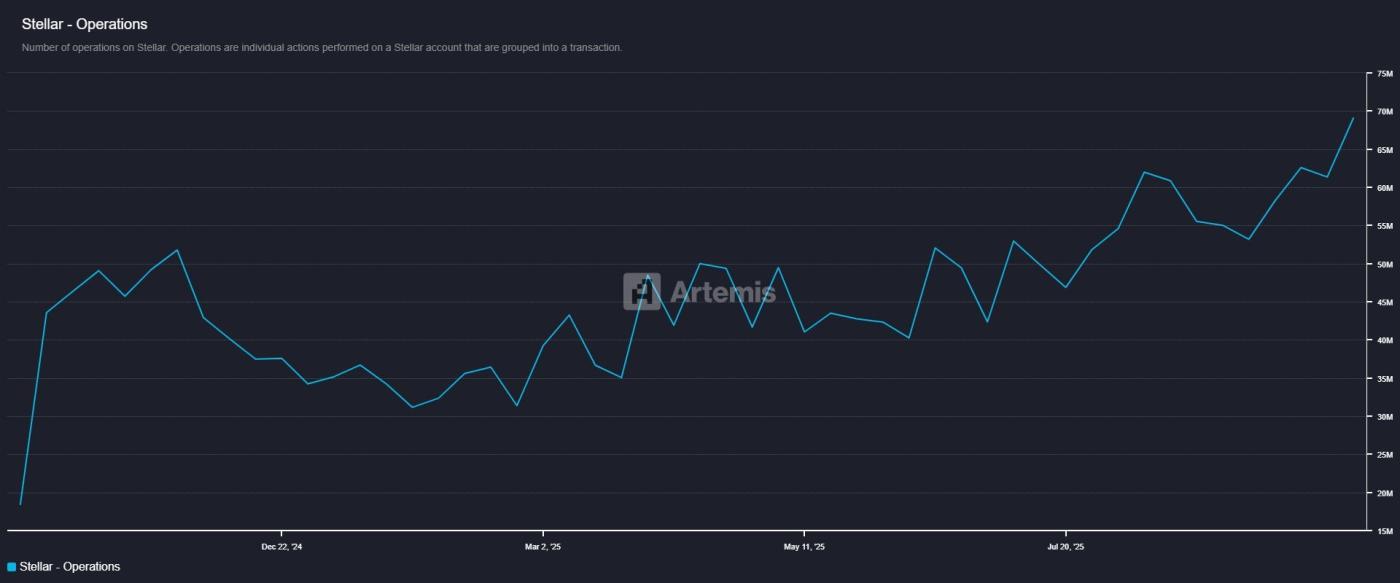 Stellar Operations. Source: Artemis
Data shows that the Stellar network currently processes over 69 million transactions per week and this number continues to grow. High network activity typically reinforces the intrinsic value of a blockchain, attracting more users and investors.
In recent months, Stellar has also expanded its partnerships with institutions . For example, Uphold, a major cryptocurrency trading platform, recently integrated EURC, a euro-backed stablecoin issued by Circle , onto the Stellar network. Meanwhile, PayPal USD launched on Stellar last month .
These partnerships have likely boosted Stellar 's on- chain activity.
2. XLM 's Correlation with BTC and ETH Hits Yearly High
The correlation between XLM and major Cryptoasset like Bitcoin (BTC) and Ethereum (ETH) has been steadily increasing throughout 2025.
According to CoinMetrics' Spearman Correlation Index, the XLM- BTC correlation is around 0.75, while the XLM- ETH correlation hovers near 0.7.
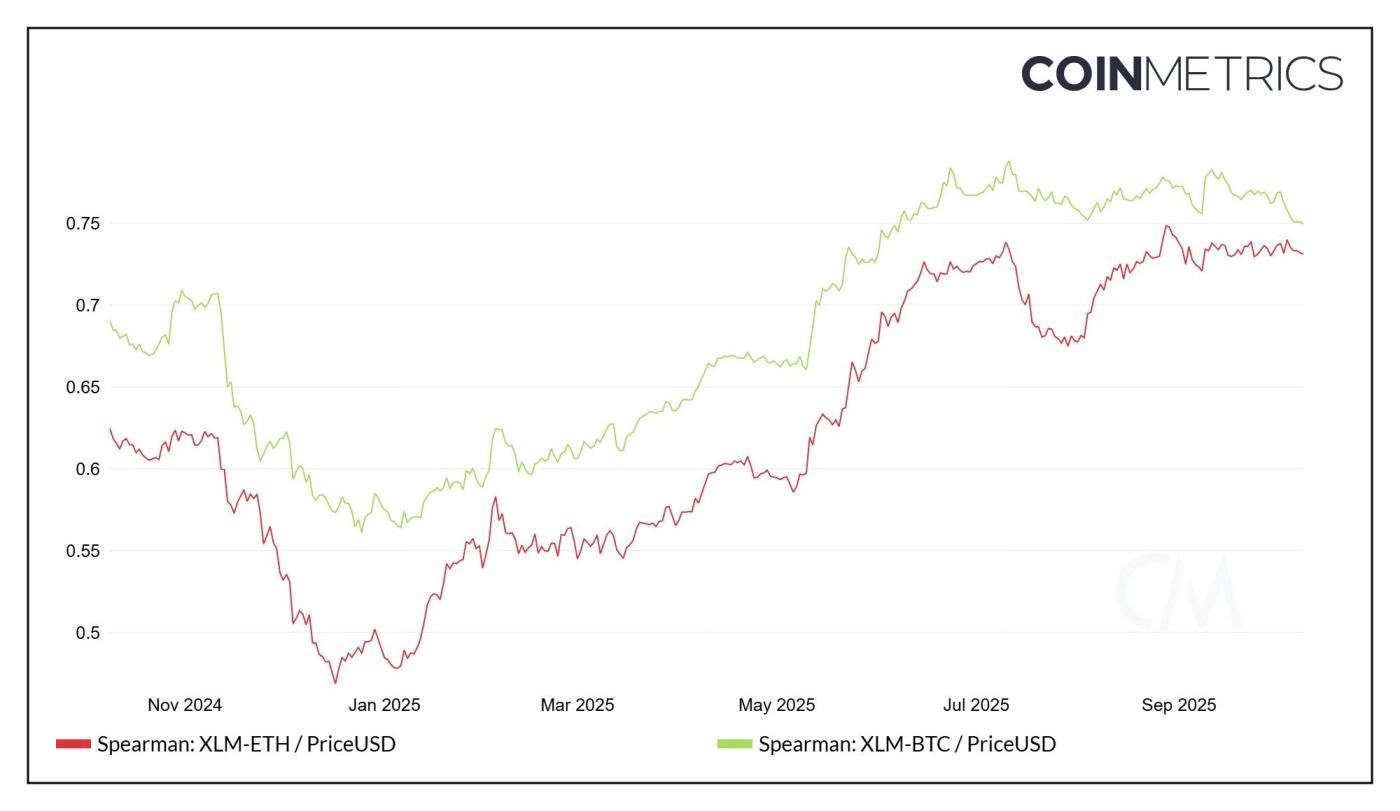 Correlation between XLM, ETH and BTC. Source: CoinMetrics
This strong correlation gives XLM a strategic advantage as it tends to move in the same direction as BTC and ETH. Analysts predict that BTC could reach $200,000 and ETH could rise to $7,500 in Q4.
In the current selective altcoin season , this correlation is more important than ever. The high correlation with BTC and ETH suggests that investors XEM XLM as having a similar level of risk and growth potential to the leading assets on the market.
3. A falling equal supply ratio (SER) indicates accumulation
The Balanced Supply Ratio (SER), a metric that measures the distribution of Token between small and large wallets, has decreased over the past month, indicating a bullish accumulation trend.
CoinMetrics defines SER as the ratio between the supply held by small addresses and the supply held by the top 1% of addresses. It essentially reflects how assets are distributed on the Stellar network.
A long-term increase in SER suggests a wider distribution of Token among retail investors. However, a sharp drop in SER often signals that large wallets are accumulating ahead of a large price move, a pattern associated with “smart money” behavior.
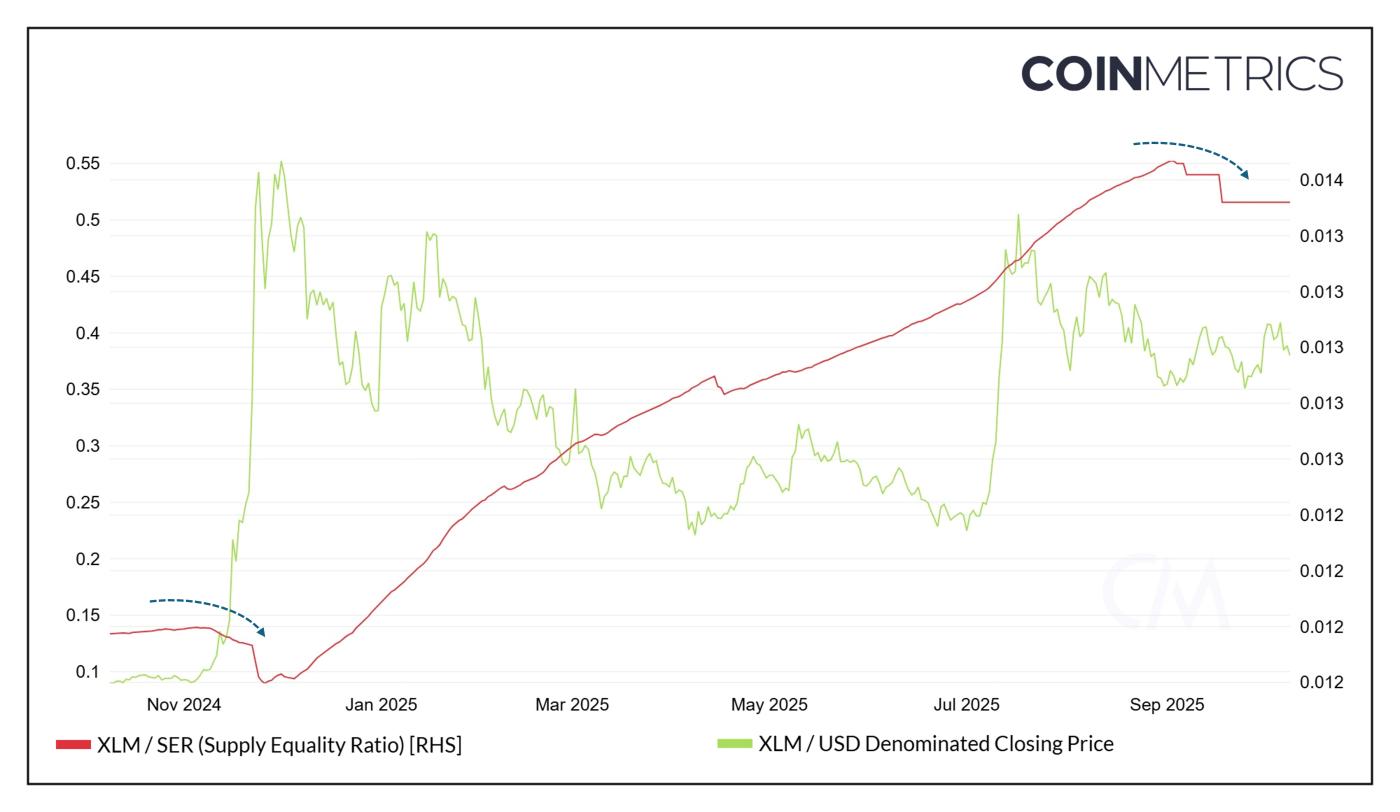 XLM Supply Balance Ratio (SER). Source: CoinMetrics .
History shows that a significant drop in SER by the end of 2024 has preceded a major price increase. This pattern implies that the top 1% of Stellar holders may be preparing for another major move.
4. XLM price structure shows breakout potential
From a technical analysis perspective, some analysts have noticed that XLM 's price structure resembles the bullish setup of 2017.
On the weekly chart, XLM broke out of a long-term Falling Wedge pattern, a pattern similar to Q4 2017 – when a similar breakout led to a strong rally.
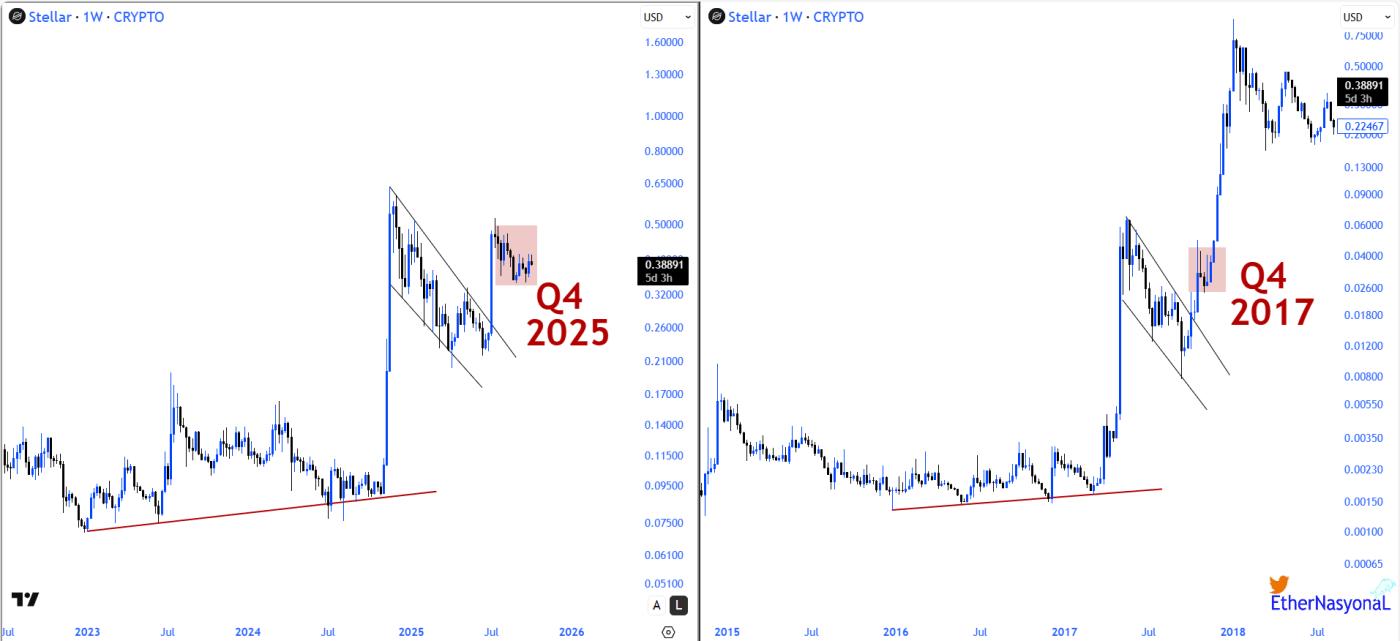 XLM price performance 2017 vs 2025. Source: EtherNasyonaL
“The 2017 and 2025 structures on the weekly chart of XLM are very similar. Both showed a breakout after an extended falling Falling Wedge pattern. The 2017 breakout resulted in a strong rally. The 2025 setup appears to be forming on the same technical basis,” one analyst said .
Looking at recent months, XLM has also broken a multi-month downtrend line. The volatility in October could be a retest before a potential upside move begins .
While these four factors highlight XLM’s intrinsic strength, external market pressure remains. The broader cryptocurrency market may still face challenges from macroeconomic factors, including recession fears and changes in monetary policy in Europe and Japan . These factors could complicate cryptocurrency price movements in the coming months.


