

BNB coin has bucked the general crypto market trend, gaining nearly 20% over the past week despite the overall market decline.
However, current technical and on chain indicators suggest that this rally may be losing momentum, as traders become cautious and start taking profits from recent gains.
BNB faces profit-taking wave
The BNB/USD daily chart confirms the shift in market sentiment around BNB. Although the price has been steadily rising in recent trading sessions, its Chaikin Money Flow (CMF) indicator has fallen sharply, creating a bearish divergence. At the time of writing, this important momentum indicator stands at -0.02.
To stay updated on TA and the Token market: Want more Token insights like this? Sign up for Editor Harsh Notariya's daily Crypto Newsletter here .
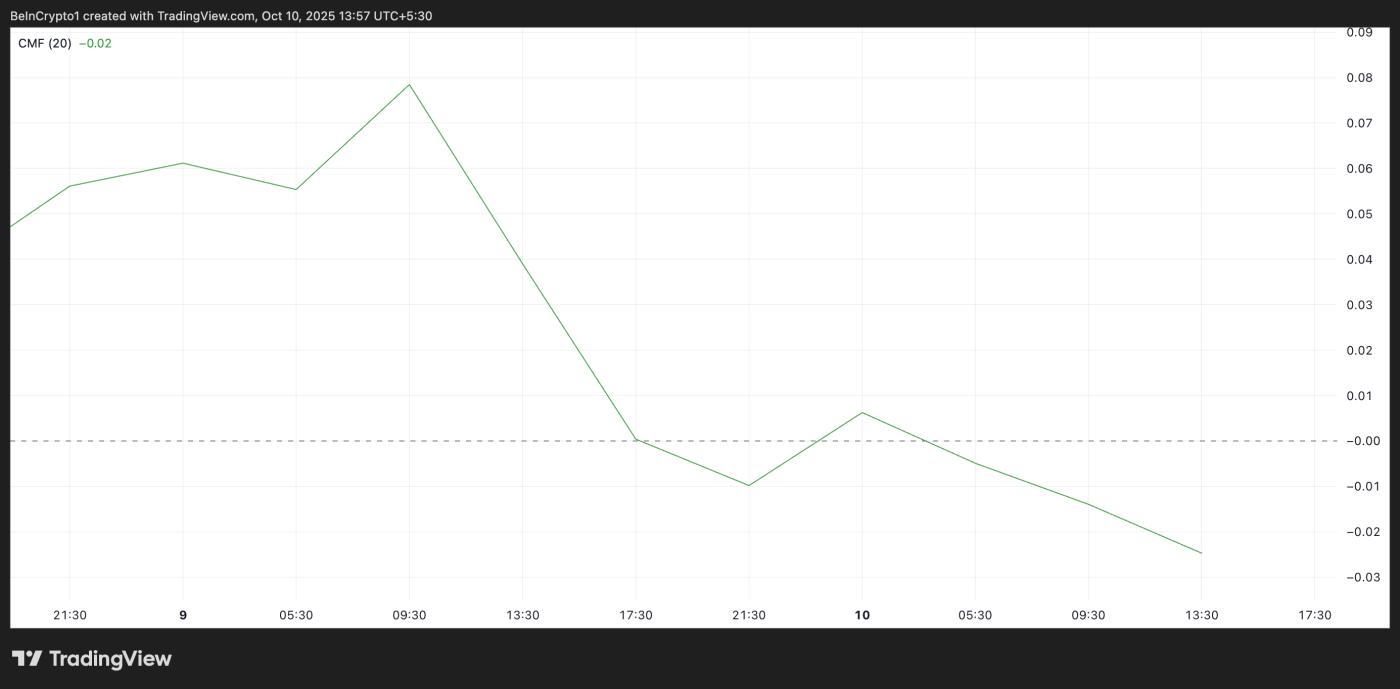 BNB Chaikin Money Flow. Source: TradingView
The CMF indicator tracks the flow of money into and out of an asset. When it falls during an uptrend, it creates a bearish divergence.
This shows that although BNB price is rising, buying pressure is weakening, and if this trend continues, the coin could give up its recent gains.
Furthermore, the BNB Longing/ Short ratio has been stable below one since October 6, 2023, highlighting the growing negative trend among Futures Contract. At the time of writing, the ratio is at 0.9354.
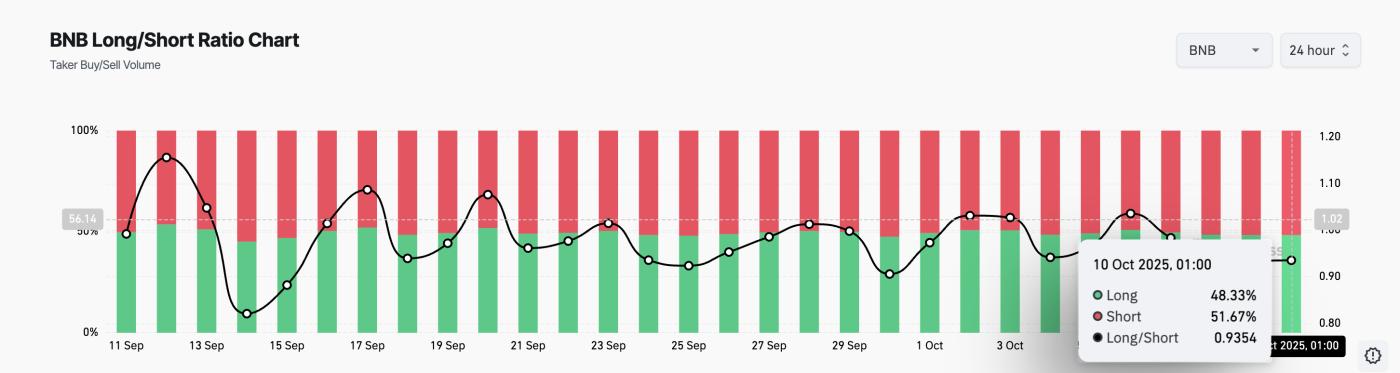 BNB Longing/ Short Ratio. Source: Coinglass
The Longing/ Short ratio measures the proportion of traders holding Longing positions (betting that an asset's price will rise) compared to those holding Short positions.
When it returns a value above one, many traders expect bullish momentum, reflecting a bullish trend in the Derivative market.
Conversely, a ratio below one, as with BNB, indicates that most traders are betting on further price declines. The continued increase in Short positions reflects expectations of a market correction, further increasing the coin's selling pressure.
BNB is hovering at $1,263
At the time of writing, the altcoin is trading near support at $1,263. If bearish sentiment prevails, this support could collapse and BNB could fall to $1,100, erasing some of last week's gains.
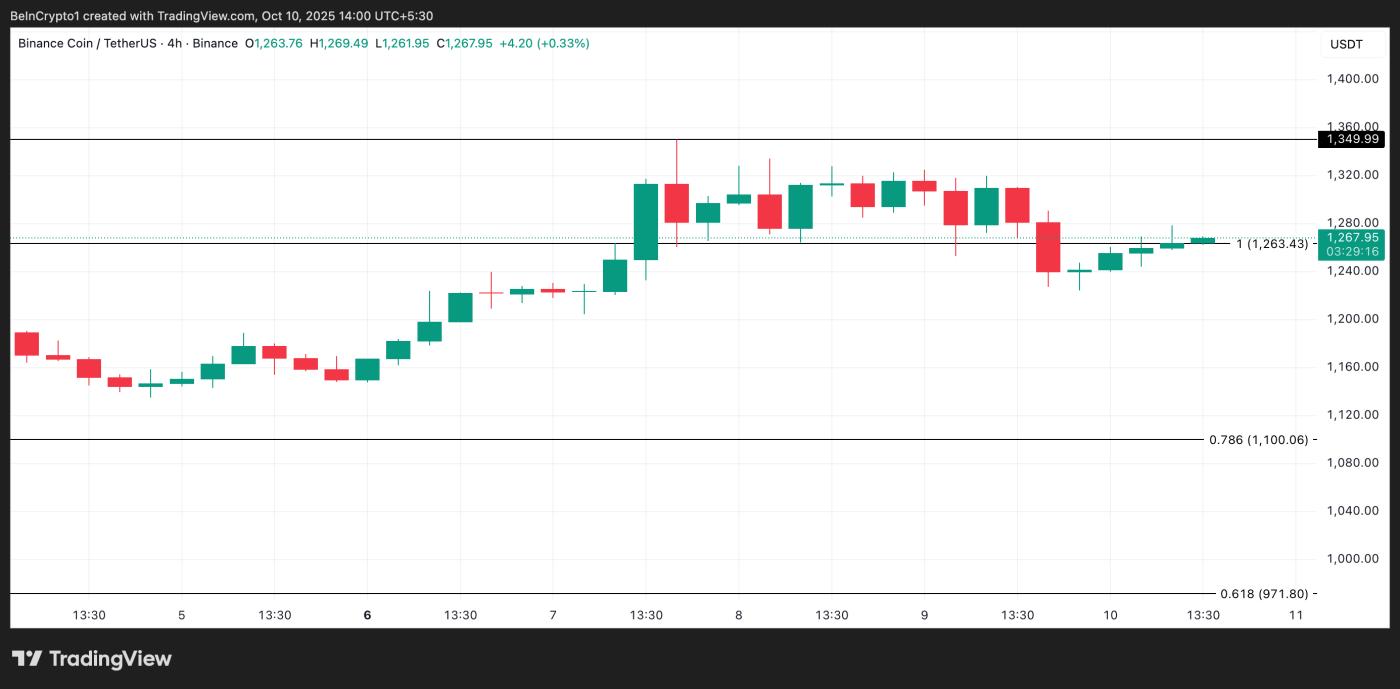 BNB Price Analysis. Source: TradingView
However, a recovery in buying activity could keep the Token above that important support level. In this scenario, the BNB price could revisit All-Time-High of $1,349.


