

Privacy-focused cryptocurrency Zcash has emerged as today’s top performer. Its value has surged 16% in the past 24 hours, defying another day of widespread losses across the broader crypto market.
However, on-chain and technical indicators suggest the token’s momentum may be losing steam. ZEC’s price has been oscillating within a tight range, and bearish pressure appears to be mounting.
ZEC’s Rally Loses Conviction
The steady decline in ZEC’s futures open interest over the past few days reflects the waning demand for the altcoin.
For token TA and market updates: Want more token insights like this? Sign up for Editor Harsh Notariya’s Daily Crypto Newsletter here.
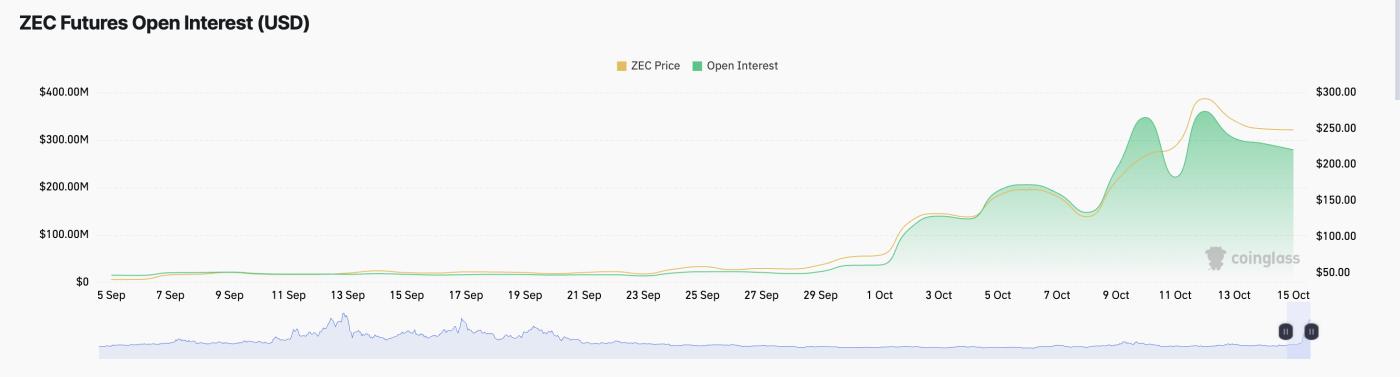 ZEC Futures Open Interest. Source: Coinglass
Down 22% over the past three sessions, ZEC’s falling futures open interest hints that investors are closing positions rather than opening new ones. This signals that the recent burst of bullish activity may be losing conviction.
Open interest refers to the total number of outstanding futures or options contracts that have yet to be settled. It serves as a gauge of market participation and trader engagement.
When open interest rises, new capital flows into the market. Conversely, when it falls, it signals that traders are exiting their positions — either taking profits or cutting losses — which results in weaker price direction.
In ZEC’s case, the drop in open interest during the ongoing rally signals that the price surge is not supported by fresh capital entering the market. This means the momentum may be short-lived, and the altcoin could witness a pullback once the short covering wanes and genuine demand fails to emerge.
Moreover, on the daily chart, the gap between the upper and lower bands of the ZEC’s Bollinger Bands indicator has widened. This points to heightened volatility and signals that the token’s recent upswing may be overextended.
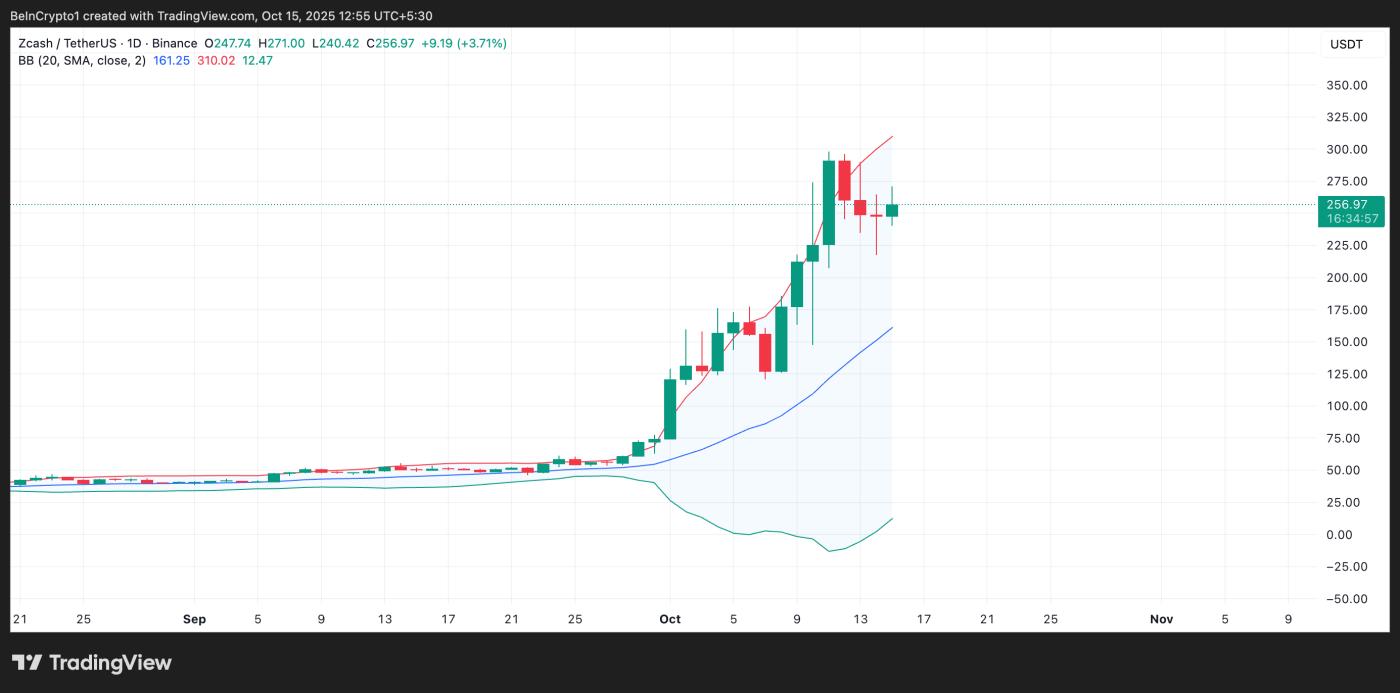 ZEC Bollinger Bands. Source: TradingView
The Bollinger Bands indicator measures market volatility by plotting two standard deviation lines above and below an asset’s moving average. When the bands widen, it indicates rising volatility, meaning price swings are becoming larger and less stable.
A sharp widening, especially following a steep price increase, as with ZEC, signals that the asset may be overbought, increasing the likelihood of a short-term correction.
ZEC’s Price Risks Falling Toward $246 Amid Cooling Demand
This combination of thinning market participation and climbing volatility puts ZEC at risk of shedding some of its recent gains. In this scenario, its price could plunge toward $236.74.
If this support floor fails to hold, the altcoin’s price could plunge further to $194.52.
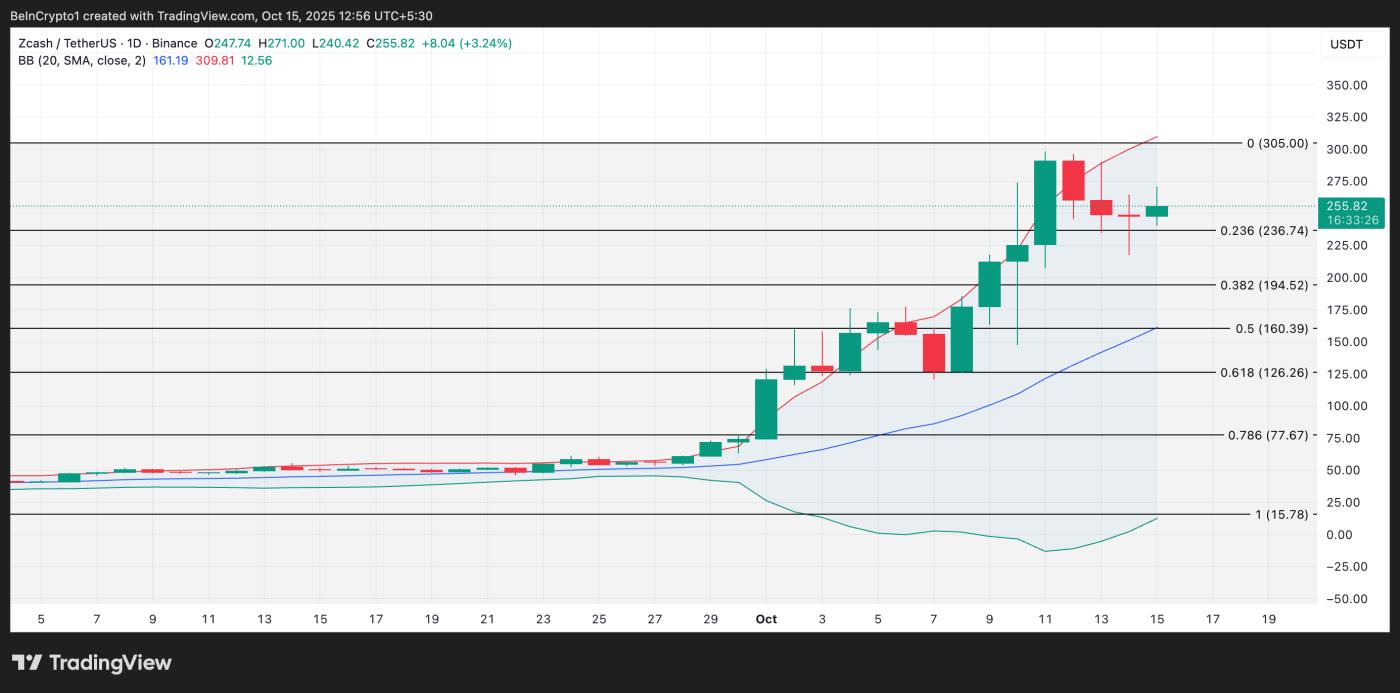 ZEC Price Analysis. Source: TradingView
However, a resurgence in new demand for ZEC would invalidate this bearish outlook. In that scenario, the altcoin’s price could climb to $305, a high last reached in November 2021.


