

Technical indicators highlight strong sell signals for Shiba Inu amid price downtrend, suggesting further correction in the coming days.
Shiba Inu is down 8.5% in the past 24 hours, following a broader market capitulation. The meme coin has now added one more zero to its price, further expanding its decimals.
However, what could one expect from Shiba Inu in the coming days? Would its price continue to drop, or would a relief rally follow? Here’s what technical indicators predict.
The indicator shows the magnitude of price change, suggesting that while prices have corrected considerably, the market is neither too strong nor too weak. Moreover, the RSI has followed the price trend and has not signaled a divergence.
Nonetheless, the Moving Average Convergence Divergence (MACD) has flashed a sell signal. It shows a bearish crossing between the MACD and the signal line, suggesting further bearish developments for Shiba Inu. The MACD histogram has also printed a red bar, confirming the potential downward price action.
Moving Averages and Possible Shiba Inu Downtrend Target
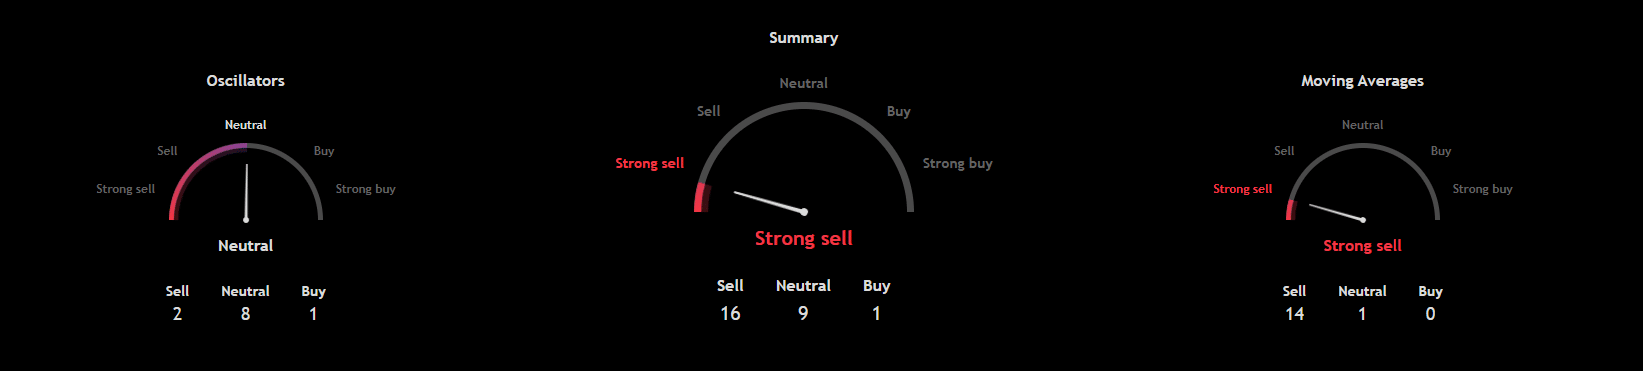
Furthermore, moving averages show a strong sell signal. Of the 15 indicators highlighted, just one is neutral, with the others all flashing bearish signs.
The 10-week to 200-week simple and exponential moving averages all suggest a downward spiral for Shiba Inu, as the token has fallen below all of them. This brings the summary of the technical analysis to a strong sell trend for Shiba Inu.
Meanwhile, if this is anything to go by, then Shiba Inu could correct further from here. How low can it go? Past analysis has identified possible targets if the meme coin turns out bearish as it is now.
For context, market watcher MMBTrader sees the support at $0.000006 as the last line of defense for SHIB. Notably, the token reached the low during its October 10 crash but rebounded heavily from there. At the current market price of $0.00000937, retesting the support level would result in a 36% decline.


