

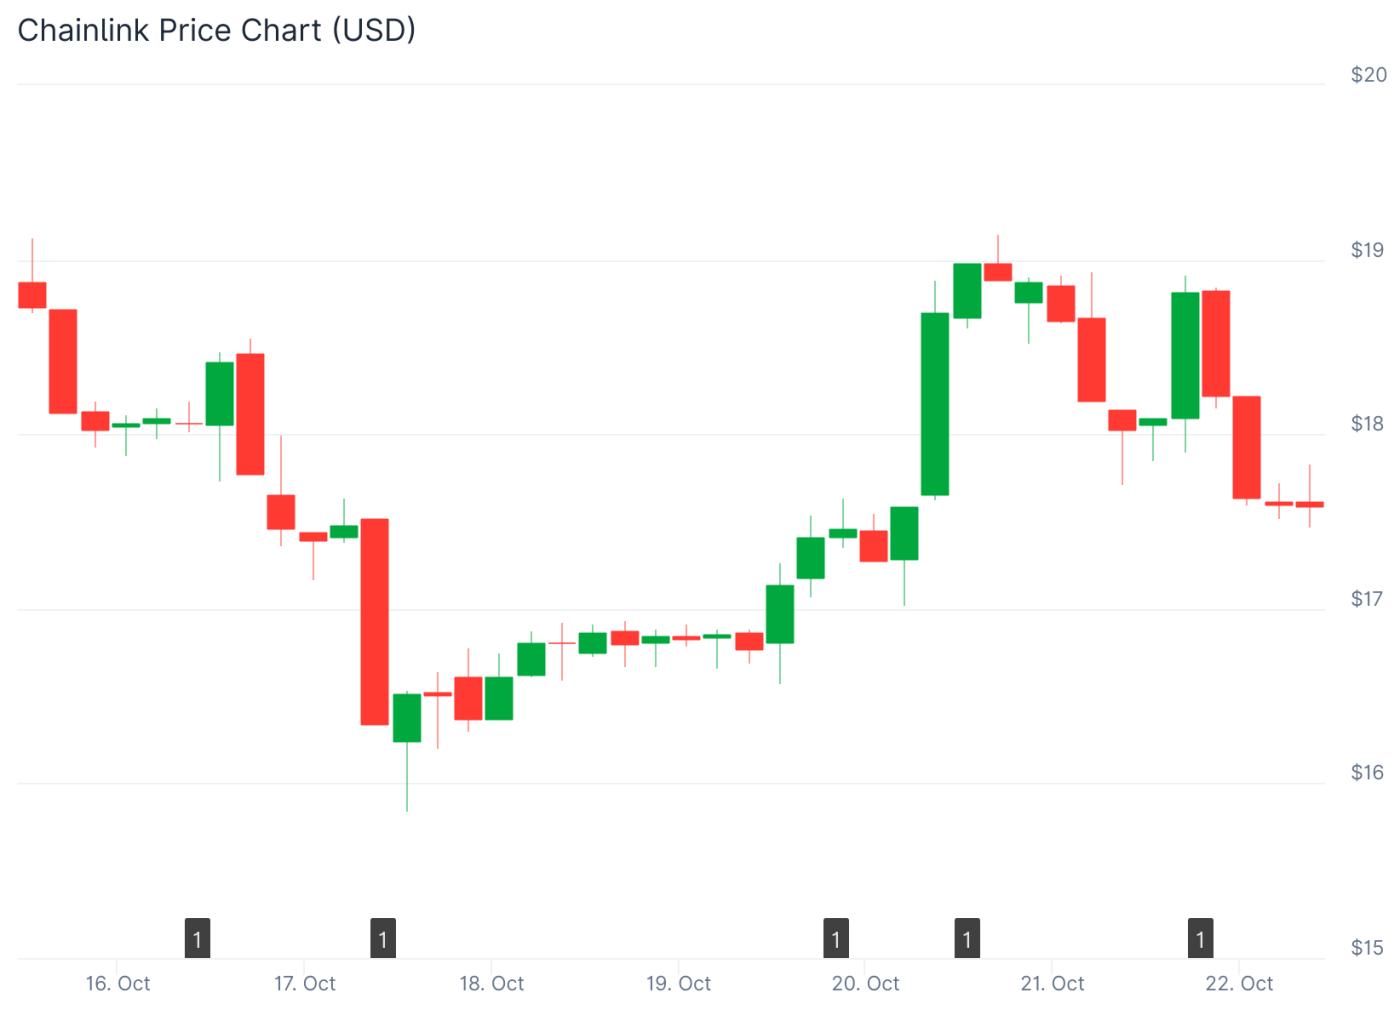
Chainlink (LINK) price recovered from the $16 support zone as whales accumulated 54 million Token , while exchange withdrawals reached $16.57 million — opening the possibility of a breakout towards $27 .
Recently, LINK bounced back from the $16 mark — a price zone that has produced strong rallies several times. On the daily chart, LINK is trading within a descending channel pattern .
Whales accumulate strongly in the $16 area
The $16 zone continues to attract buying interest, indicating growing investor confidence that this is a low value zone.
According to on-chain data, large investors have gathered around 54.47 million LINK around this price level, solidifying this as the Token's strongest support zone .
Historically, whale buying around this area has coincided with local bullish reversals . The steady buying activity demonstrates confidence in LINK's ability to recover after each correction.
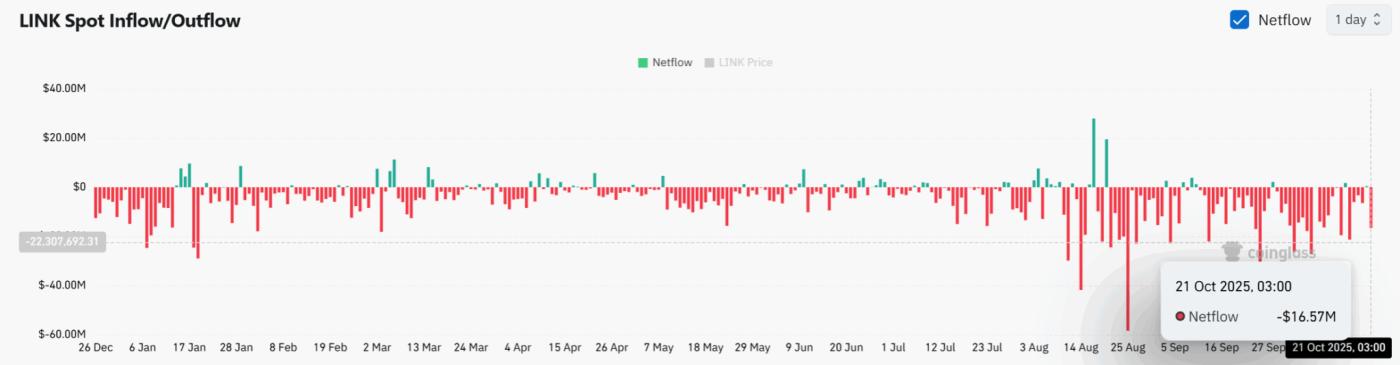
Exchange cash flow data also supports the uptrend: on October 21 , LINK recorded a total net withdrawal of $16.57 million , one of the highest levels in recent weeks.
As more Token leave exchanges, circulating supply decreases , creating liquidation scarcity — often a signal of upcoming bullish pressure .
Technical patterns indicate breakout potential
On the daily chart, LINK is moving within a descending channel , with a key resistance level at $19.95 — an area that has repeatedly determined the strength of previous uptrends.
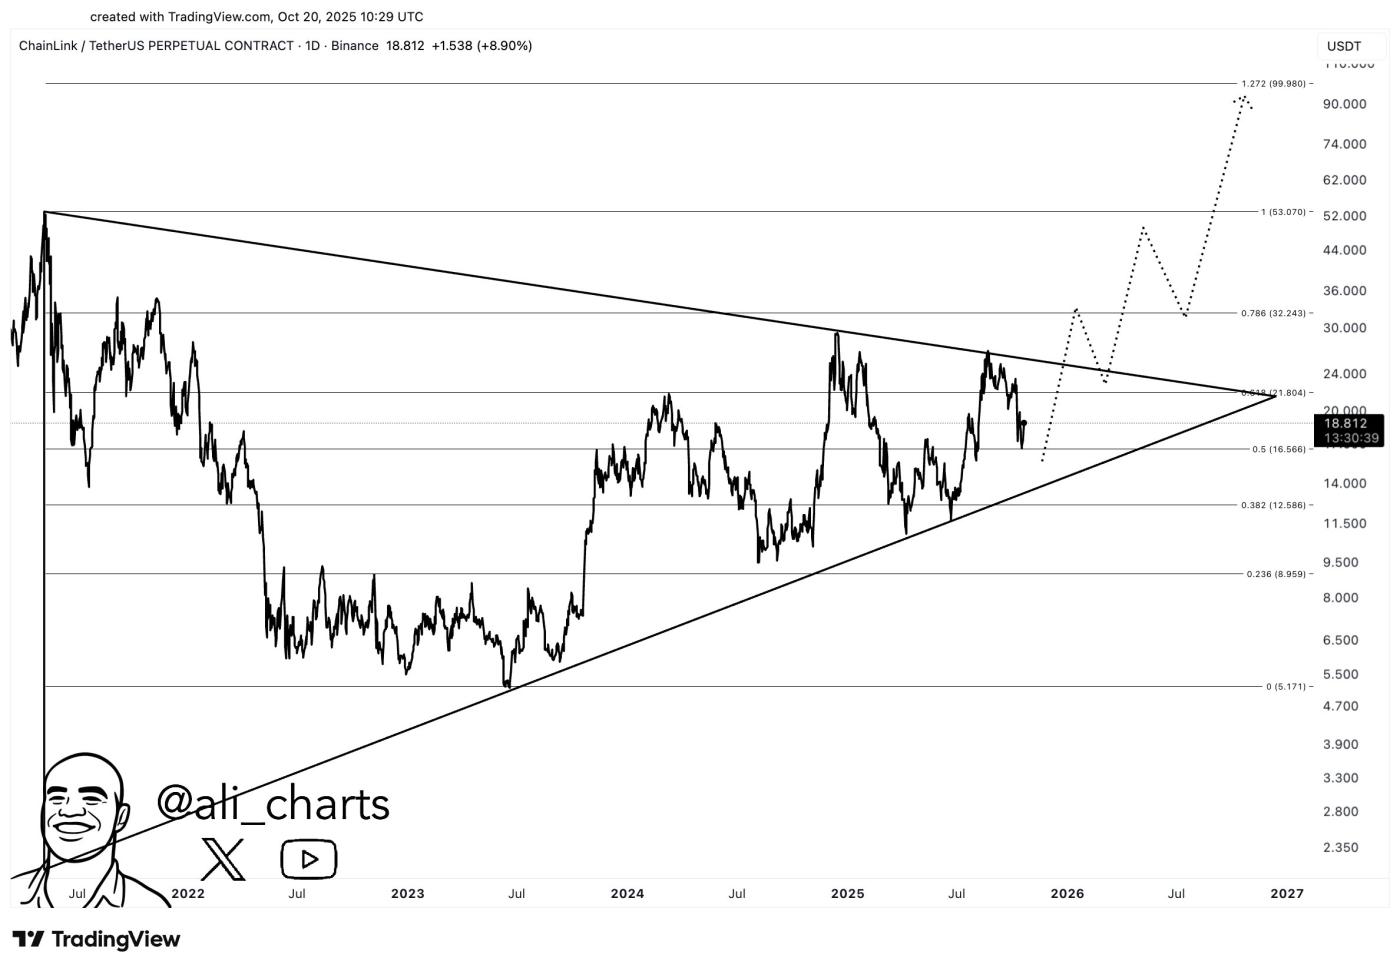
Whenever LINK breaks above this level, a strong bullish momentum usually follows . Some analysis shows that LINK is accumulating in a symmetrical triangle pattern that has been forming since 2022 , signaling an upcoming breakout phase .
If LINK breaks the $19.95 mark , the price could retest the $23.6 zone , and if the bullish momentum is maintained, a target of $27 by December is possible.
Multi-year triangle pattern coming to a decision point
This pattern is neither a full ascending nor a symmetrical triangle , but rather falls in between. LINK touched the upper part of this pattern earlier this year and was rejected, then fell back down .
LINK is now approaching the bottom of a multi-year accumulation channel where the price range narrows — which typically signals an impending breakout .
If the price breaks above the triangle pattern , it will be a strong bullish signal . Conversely, if it falls below the channel , the downtrend may resume.
The upcoming retest will be the deciding factor in LINK’s next move. If it breaks the resistance zone around $25 , analysts believe that LINK could enter a new bull cycle .
Some analysts are also eyeing the 1.272 Fibonacci extension level , which would equate to around $100 — as a potential long-term target .
Overall, the chain of higher Dip , whale inflows , and Token withdrawal trends are all reinforcing the positive picture for LINK.
The $16 demand zone continues to act as the backbone for the recovery structure , while the falling supply on the exchanges confirms that selling pressure is waning .


