

Solana price has had a tricky few weeks. Each attempt to break resistance has ended in a short-lived bounce. The token is down 10% over the past seven days but still holds a small three-month gain of about 2%, keeping its broader uptrend intact.
Now, another bounce looks possible — and this time, both on-chain and chart data suggest it could build into something stronger, provided the Solana price clears key resistance levels.
Short-Term Buyers Step Up as Long-Term Pressure Eases
Blockchain data from HODL Waves shows that short-term holders are back to accumulating. This metric tracks what percentage of a token’s total supply is held by different age groups of holders.
Over the past two weeks, wallets holding SOL for one to three months have increased their share from 14.61% on October 7 to 18.46% on October 21, a gain of roughly 26%, showing clear accumulation near recent lows.
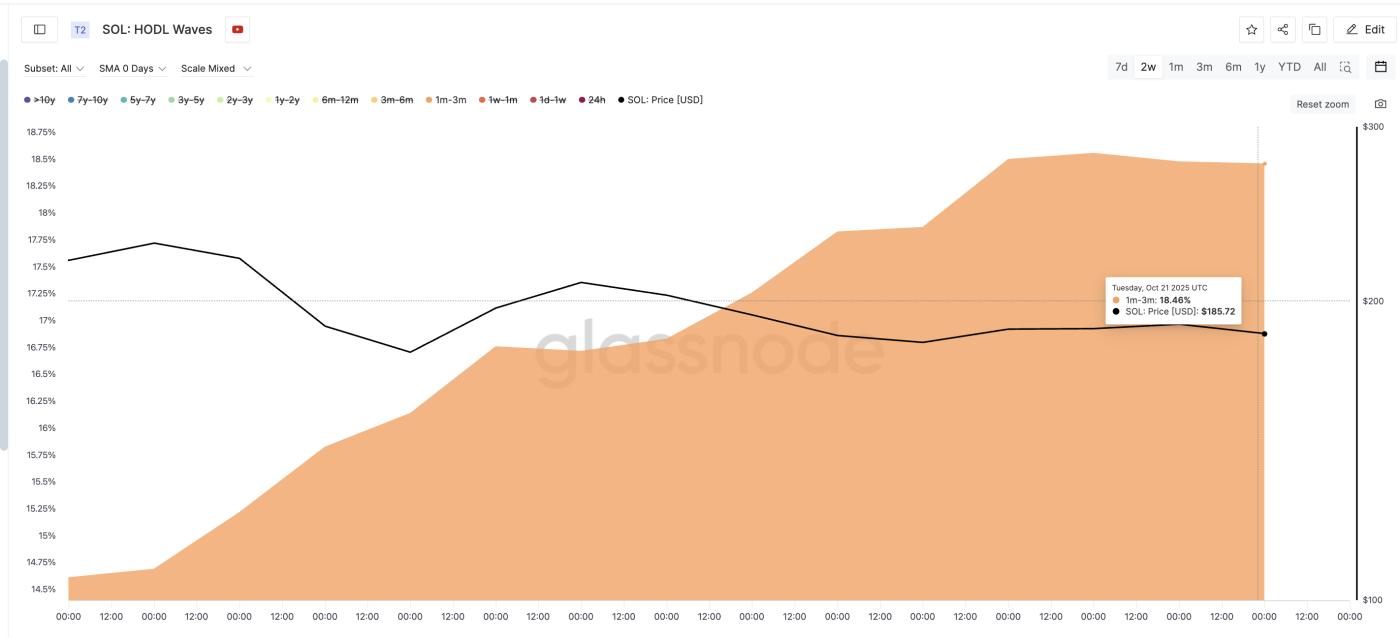 Short-Term Holders Add SOL: Glassnode
Want more token insights like this? Sign up for Editor Harsh Notariya’s Daily Crypto Newsletter here.
Meanwhile, long-term holders are still selling, but at a slower pace. The Hodler Net Position Change metric — which measures how much long-term investors are increasing or reducing holdings — remains negative.
This means coins are still leaving older wallets. However, the outflows have dropped sharply by about 59%, from -10.52 million SOL on October 7 to -4.33 million SOL on October 21.
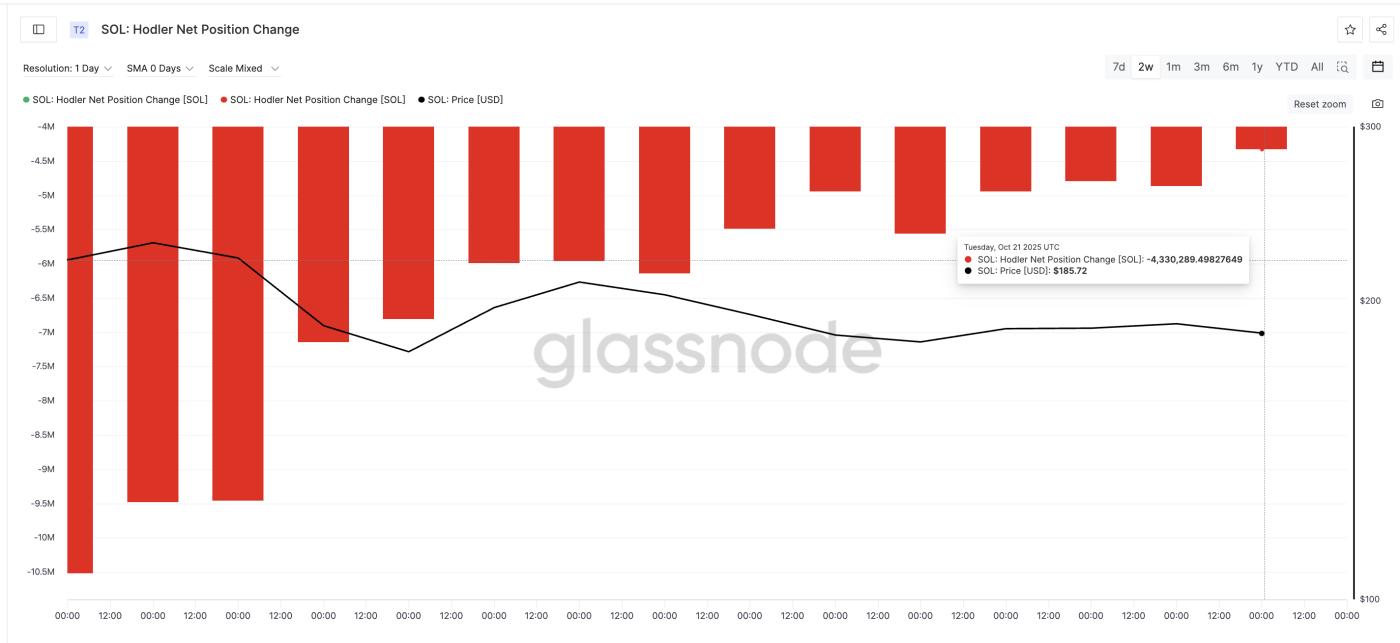 Solana Holders Are Selling Fewer Tokens: Glassnode
The shift signals that short-term buyers are now absorbing most of what long-term holders are selling. The slowing sell pressure, paired with active dip buying, supports the case for a stronger bounce. If resistance levels are cleared, that could evolve into a breakout.
However, the Solana price bounce theory could get a bigger push if the net-selling turns into net-buying.
Solana Price Structure Points to a Breakout Window Opening Soon
On the daily chart, the Solana price continues to move inside a falling wedge, a setup that often resolves upward. The Relative Strength Index (RSI), which measures the speed and strength of price movements, shows a bullish divergence, where RSI has made higher lows while price made lower lows between September 25 and October 21.
This pattern usually leads to a trend reversal, but the SOL price has been settling for mere bounces.
A bullish divergence means momentum is improving even though price hasn’t yet reacted, hinting that sellers are losing control. A similar pattern between September 25 and October 17 triggered a 13.4% rebound (bounce), lifting Solana from $174 to $197.
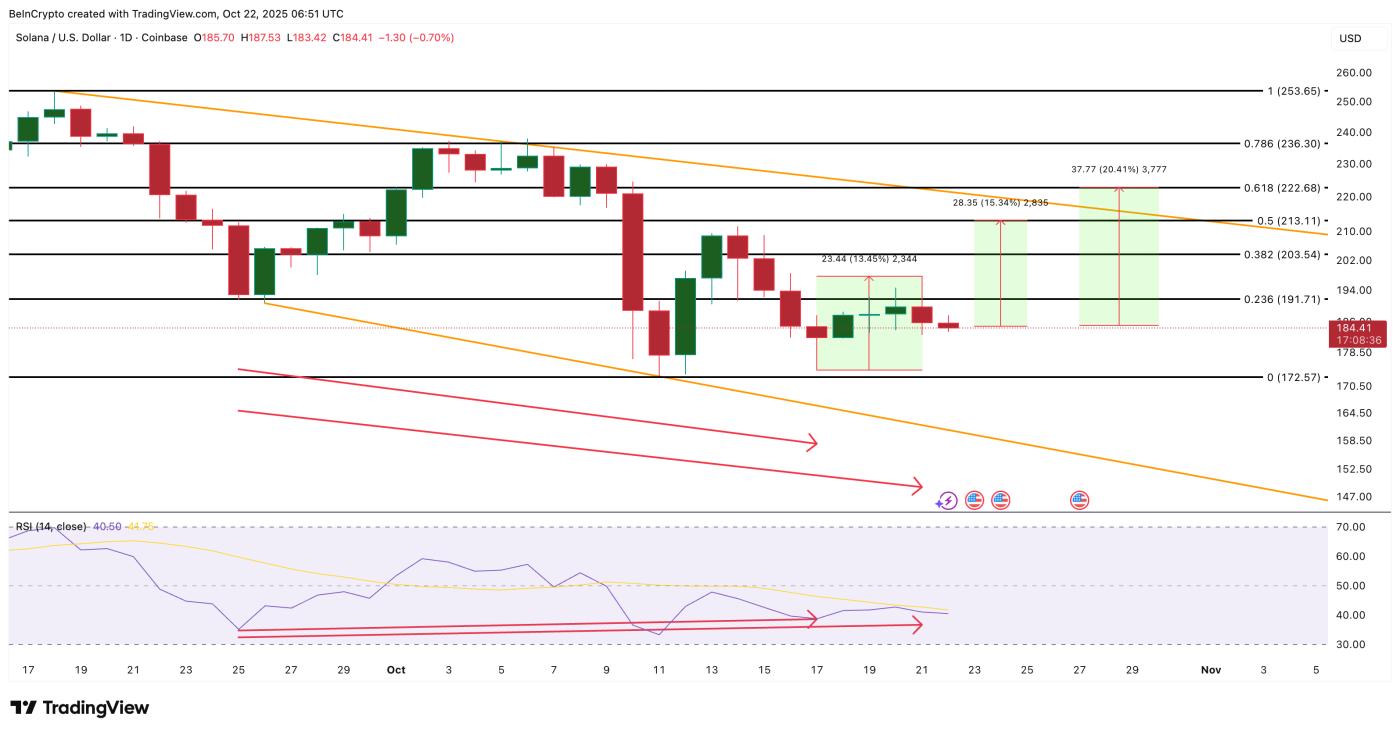 Solana Price Analysis: TradingView
If the same behavior repeats, a 15% rise from the current level near $184 could take Solana to $213, breaking its lower-high price pattern. A further 20% move to $222 would confirm a wedge breakout and possibly extend the rally toward $236–$253.
However, if Solana drops below $172, the bullish structure would break down and could trigger a deeper slide. As the lower trendline of the wedge is formed using two touchpoints, it could be weaker. Therefore, a dip under $172 is something that bullish Solana traders might be wary of.
For now, improving momentum and easing sell pressure show that this bounce might finally have enough strength. Even for a Solana price rally to start.


