

October has not been kind to XRP prices. The Token has fallen more than 12% this month, repeating a similar weakness that occurred in October 2024. As November approaches, many traders are wondering if XRP can repeat last November’s historic performance, when it rose more than 280%. Even a fraction of that increase would be enough to make the XRP trading community happy.
on-chain data currently shows a mixed picture — the majority of holders are selling, a few whales are quietly buying, and the price is moving in a narrow pattern that can break in either direction.
Long and short term holders are still taking profits
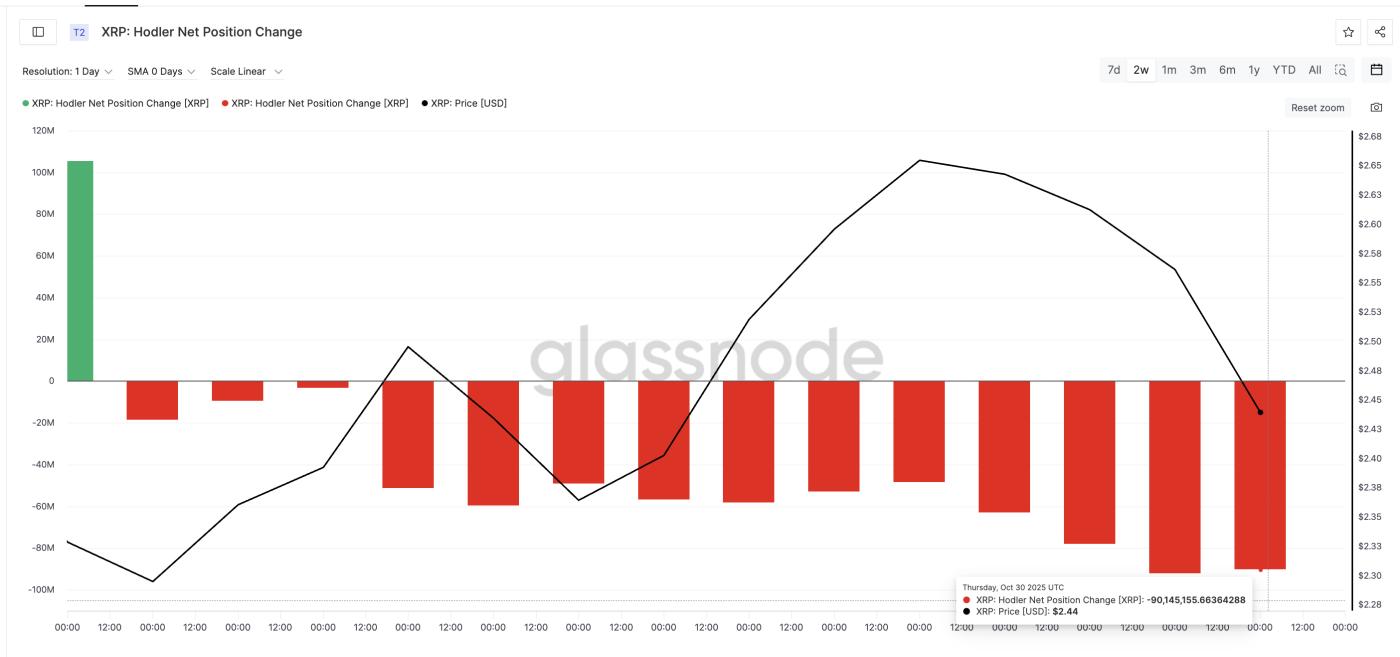
The Hodler Net Position Change metric, which tracks the difference between the amount of XRP entering and leaving long-term wallets, shows that long-term holders are taking profits more aggressively.
On October 19, 2025, the outflow was at –3.28 million XRP, but by October 30, 2025 it had widened to –90.14 million XRP.
 Strong selling holder: Glassnode
Want more perspectives on Token like this? Subscribe to Editor Harsh Notariya's daily Crypto Newsletter here .
That's a 2,647% increase in net XRP outflows in just two weeks, suggesting long-term investors are stepping up their selling instead of slowing down.
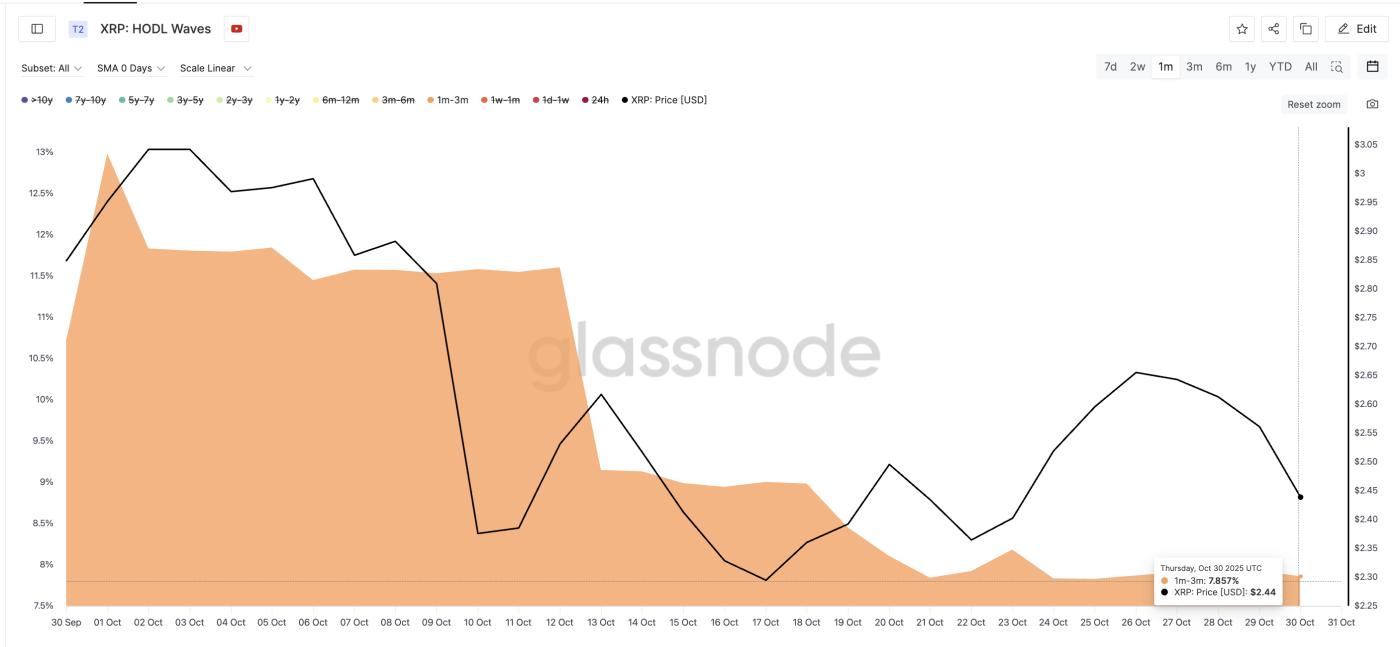
The Hodl Waves chart, which breaks down XRP supply by holding time, shows a similar trend in the short-term group. The 1–3 month group, representing new investors, has reduced its share of supply from 12.98% in early October to just 7.85% now — a sharp decline of 39.5%. This steady decline signals that short-term traders are exiting positions as volatility increases.
 Hodl Waves Reveal Short-Term Selling Pressure: Glassnode
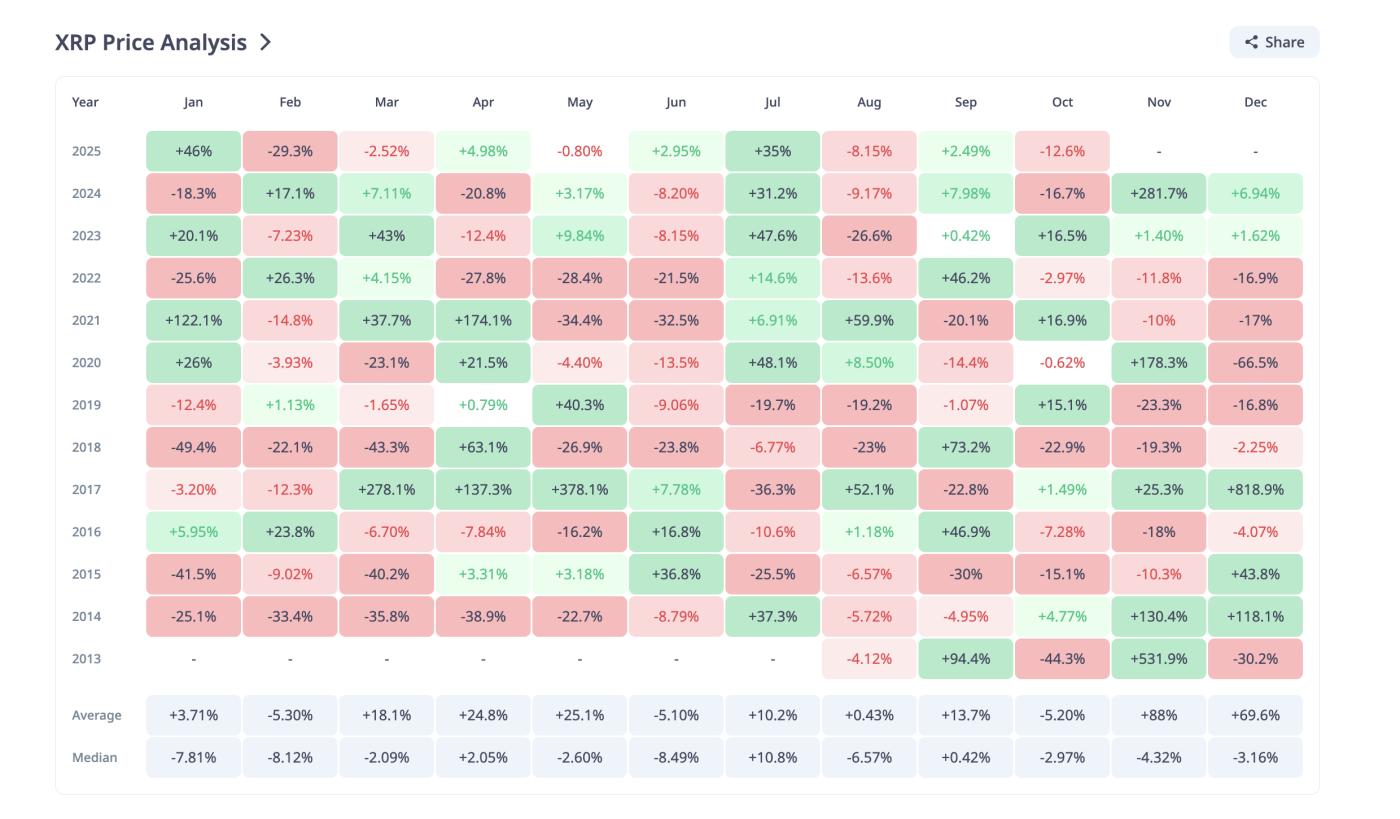
Interestingly, history shows that November is typically XRP's strongest month , with an Medium gain of +88% and a median gain of +25%.
 XRP Price History : CryptoRank
However, that strength often relies on accumulation within these groups themselves. Their current selling pressure therefore limits their ability to repeat this year’s performance — unless whales step in to fill the gap.
Whales are quietly accumulating ahead of November
While retail investors are reducing their exposure, large wallet addresses are quietly accumulating.
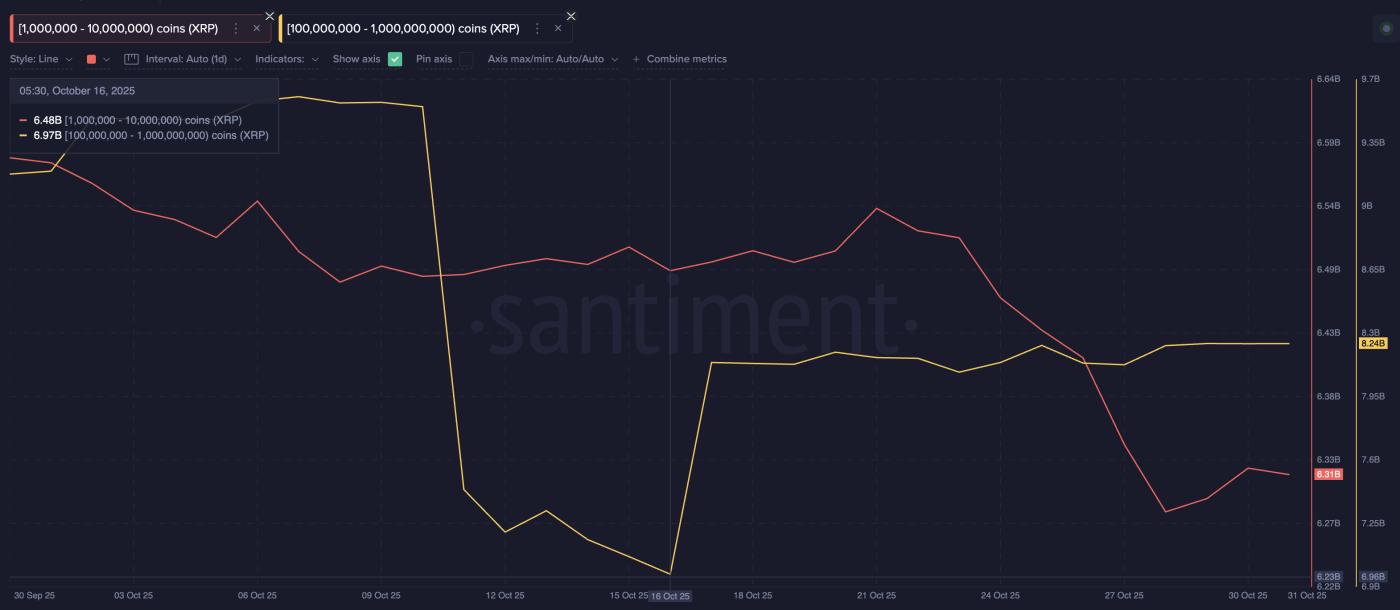
Whales holding between 100 million and 1 billion XRP have increased their holdings significantly over the past two weeks. Their consolidated reserves increased from 6.97 billion XRP on October 16, 2025, to 8.24 billion XRP on October 31, 2025 — an increase of 1.27 billion XRP, or about $3.15 billion at the current price of $2.48.
 XRP Whales in Action: Santiment
This contrasts with the mid-sized whales holding 1 million to 10 million XRP, who were net sellers for much of October. But the trend may be reversing. From October 28, 2025, to October 30, 2025, their balance increased from 6.28 billion to 6.31 billion, adding about 30 million XRP, worth about $74 million.
A return to accumulation by mid-sized whales often signals an early stabilization phase — a key precursor to any sustained rally.
Maria Carola, CEO of StealthEx, believes that this shift reflects a more mature market structure. She also points to a few price zones that could form a consolidation cluster:
“The current XRP market structure represents a maturing dynamic, characterized by measured accumulation and disciplined risk management. A solid support zone has formed around $2.60–$2.63 — a key pivot that could determine the near-term direction,” she Chia .
It would be interesting to see if these willing whales can offset selling pressure from specific holding groups in November.
Supply Zones, XRP Price Levels, and What Could Fuel the Next Move
The Capital distribution heatmap, which shows where most Token were last purchased, highlights two dense supply zones that are holding XRP back.
The first zone is located near $2.52–$2.54, where around 1.23 billion XRP has accumulated. This explains why XRP has repeatedly failed to hold above $2.59.
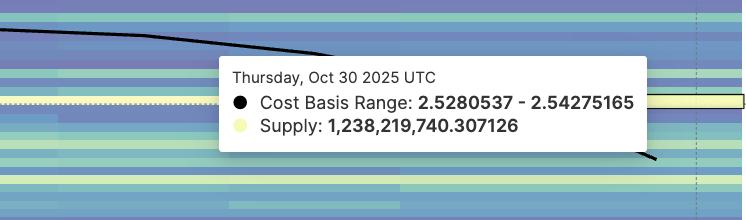 Nearest support level under supply pressure: Glassnode
The second, stronger barrier lies in the $2.80–$2.82 range, where around 1.88 billion XRP were purchased. This is the key area that will determine whether XRP price can break out into a sustainable uptrend.
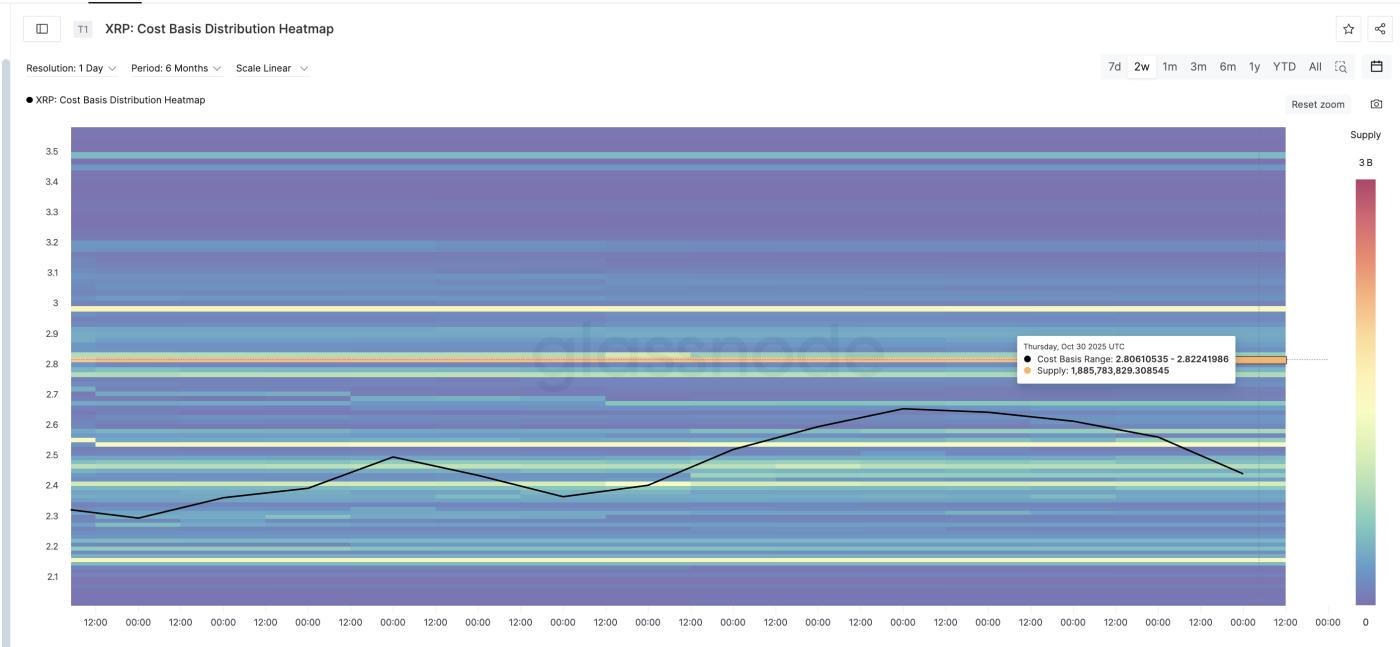 XRP Heatmap and Milestones : Glassnode
Meanwhile, the 2-day price chart shows XRP consolidating in a symmetrical triangle pattern, reflecting the tug-of-war between buyers and sellers. The lower trendline has only two touches, making it quite weak, increasing the likelihood of a short-term decline if selling pressure returns.
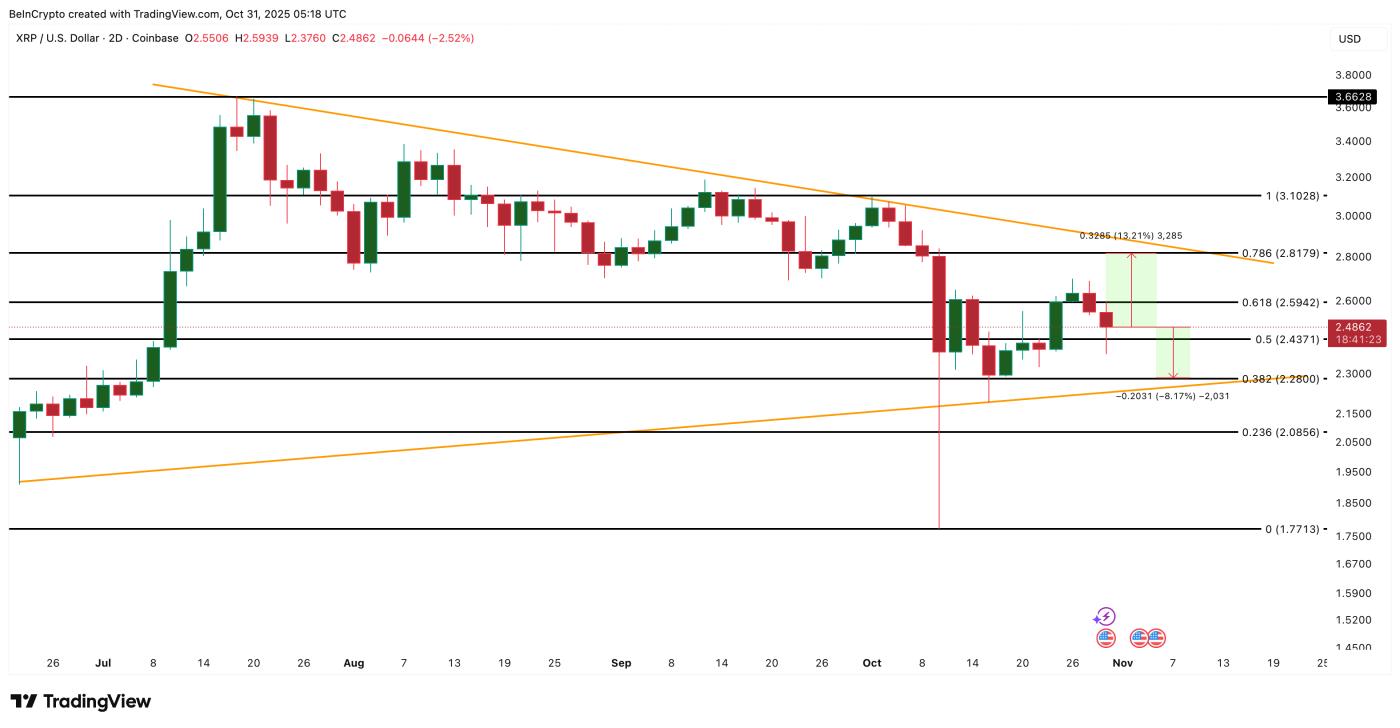 XRP Price Analysis : TradingView
Maria Carola adds perspective and reinforces the $2.59 XRP price point we mentioned earlier:
“As long as XRP holds above $2.60, the path of least resistance remains to the upside. A break above $2.67–$2.70, supported by a return to Capital rotation, could even retest $3 if macro tailwinds emerge,” she said.
A break above $2.81 (confirmed by the heatmap) would further strengthen the bullish thesis. That could push the price to $3.10 or even $3.66. On the other hand, a drop below $2.28 could see the price retreat to the $2.08 area.
However, the selling waves and the weakness of the lower trendline make the possibility of a decline quite high if the market conditions worsen, which will prolong the correction of XRP price before any recovery attempt.


