

Zcash is continuing its explosive rally, rising 14% today and pushing its monthly gain above 200%. The privacy Token (ZEC) has gained more than 1,130% over the past three months, making it one of the market’s strongest performers.
While indicators still show bullish momentum, the high leverage could make the climb to higher targets — including $1,567 — far from safe.
Can Hidden Bullish Divergence Help Sustain Zcash's Uptrend?
From October 3 to October 30, ZEC price made higher Dip , while the Relative Strength Index (RSI) — a tool that tracks buying/selling power — made lower Dip .
This is known as hidden bullish divergence, which often signals that the existing uptrend is likely to continue.
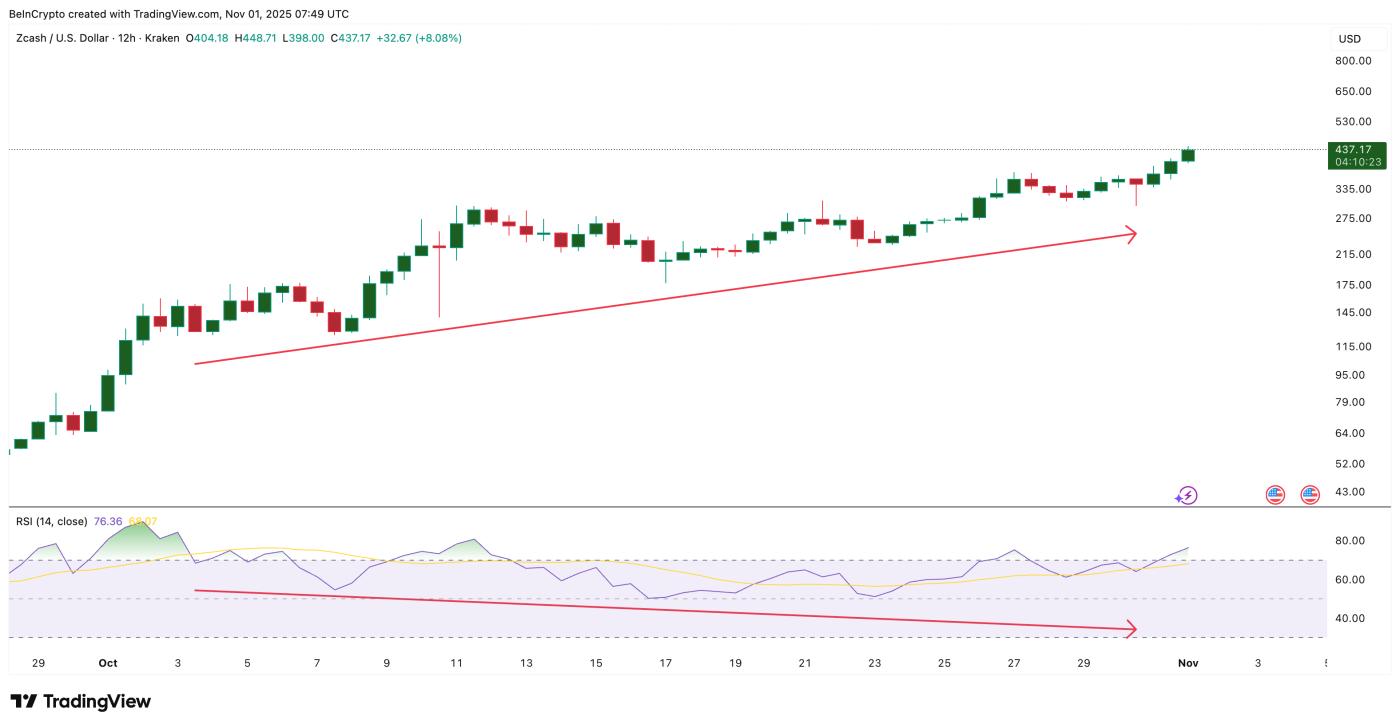 Hidden bullish divergence in action: Tradingview
Want Also Read Token analysis like this? Subscribe to editor Harsh Notariya's Daily Crypto Newsletter here .
Zcash 's RSI remains above 70, indicating strong buyer control despite brief bouts of profit-taking. This pattern suggests traders are re-entering the market rather than exiting, keeping the trend intact. However, the rising RSI could eventually lead to a correction scenario for Zcash.
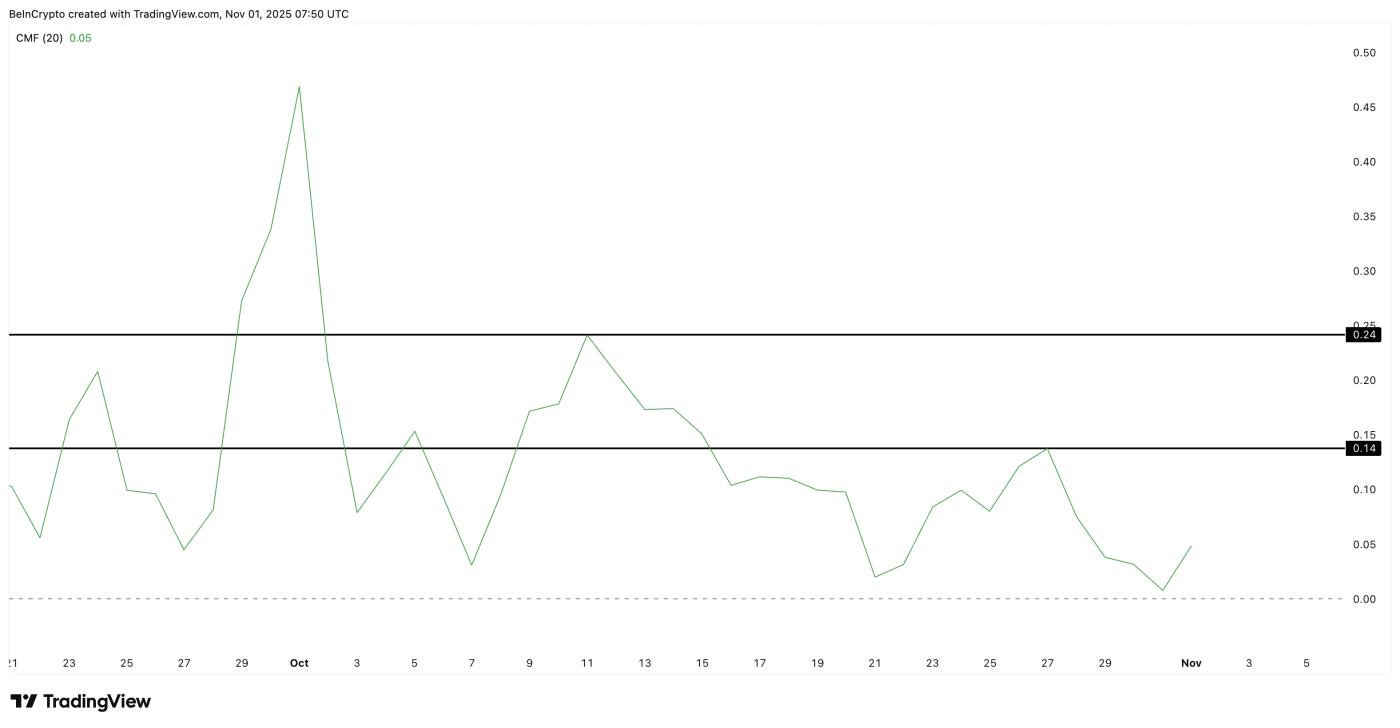
Supporting the overall positive picture, Chaikin Money Flow (CMF) — a measure of large money flows in and out of the market — remains positive.
 ZEC Whales Still Present: TradingView
ZEC CMF has not fallen below 0 for weeks and is currently around 0.05, indicating steady inflows. If it breaks above 0.14 and moves towards 0.24, it could trigger a new wave of buying, thereby fueling a larger rally in the short term.
Notably, despite the large outflow of money from ZEC in late October, the indicator has actually never gone below zero.
And this indicator turned up on November 1, suggesting that whale confidence is increasing.
Longing leverage increases confidence — and risk
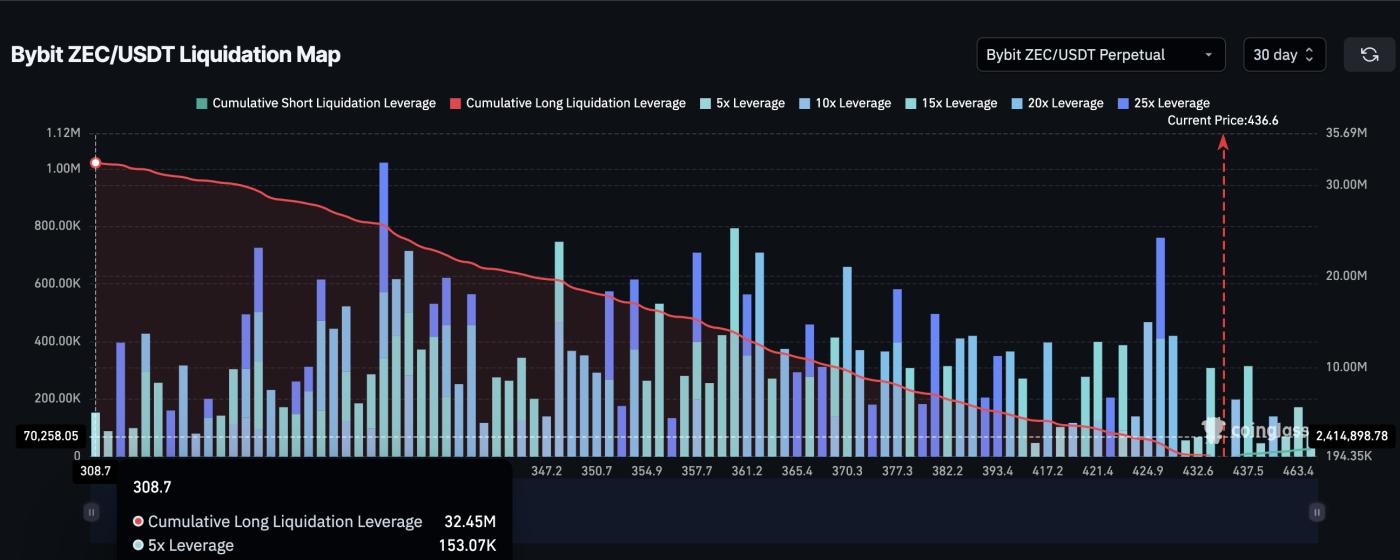
This bullish setup has attracted leveraged traders to record levels. According to Bybit’s liquidation map, total leverage on Longing positions on the ZEC/ USDT pair is around $32.45 million, while Short position leverage is $1.04 million — nearly 30 times low.
The recent 24-hour surge may have liquidated a fair amount of Short positions.
 ZEC Liquidation Map: Coinglass
This also means that the majority of traders are betting on continued price increases, but it also creates a delicate balance. If the price of Zcash drops even slightly, highly leveraged Longing positions could be liquidated quickly, creating additional selling pressure.
Therefore, $342 and $312 become the most important support zones in the short term, as we will see below. A fall below $312 could trigger a chain chain of liquidations.
ZEC Price Prediction: Could the Bull Run Surpass $1,500?
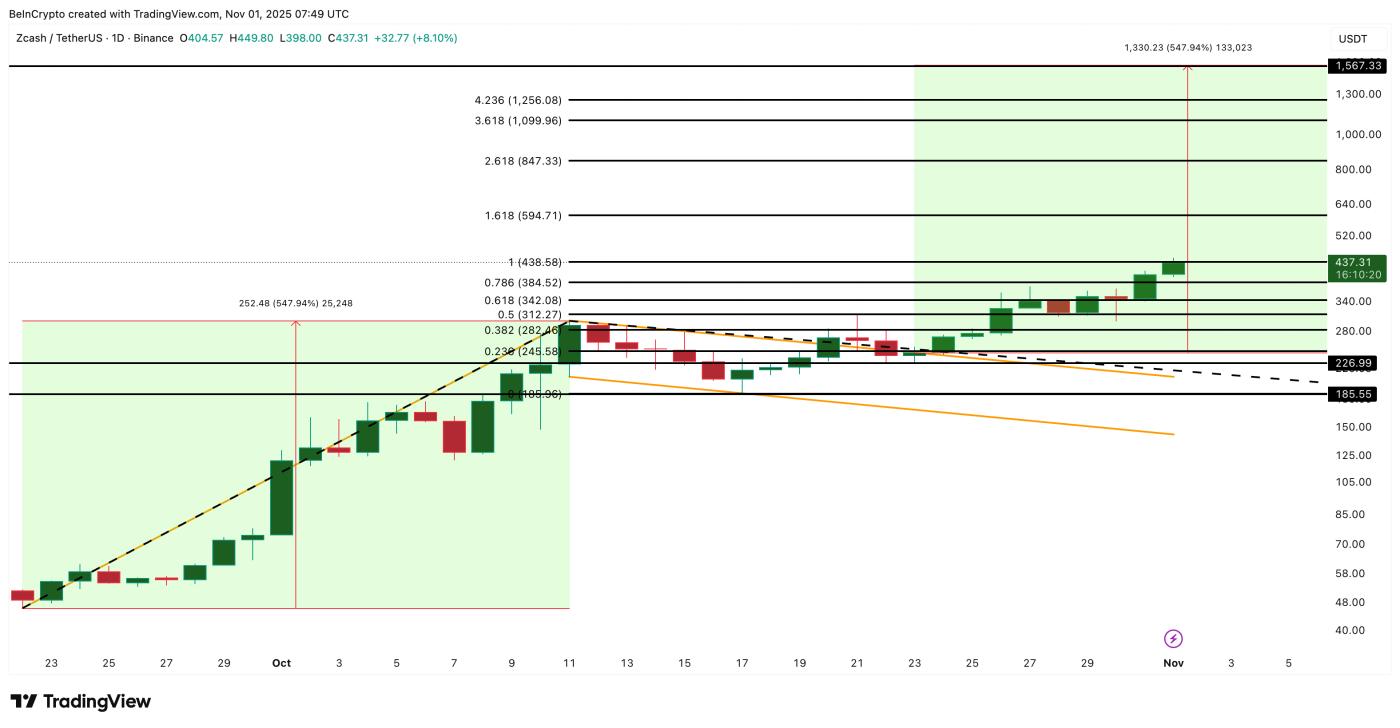
Zcash price continues to trade within the flag and column pattern it just broke out of, as predicted earlier . This is a structure that usually appears before strong bullish expansions.
A breakout above $438 would confirm further upside, with next Fibonacci targets at $594, $847, and $1,256.
Project the full flagpole height for a long-term target around $1,567 — representing about 250% upside from the current price zone near $437.
 Zcash Price Analysis : TradingView
However, Zcash ’s strong rally also means high volatility. The combination of its bullish structure, strong inflows, and excessive leverage makes this rally both promising and risky.
The uptrend remains intact for now — but traders need to keep a close eye on the $312 level, as a loss could turn the story around very quickly. A break below this level would trigger liquidation of all existing Longing positions, according to the liquidation map Chia earlier.
However, as long as ZEC price holds above $342 (0.618 fib level), any dip will look like a healthy correction.
If ZEC loses $245, the bullish momentum will weaken. And if it breaks $185, the entire bullish structure will collapse.


