

Bitcoin Price Suffers Another Major Drop
Bitcoin is once again testing traders’ nerves. The leading cryptocurrency fell sharply from $116,000 to around $107,300, marking a significant 3% decline within 24 hours. This sell-off follows a series of lower highs since mid-October, reinforcing concerns that Bitcoin’s bullish momentum may be losing steam.
The daily chart shows Bitcoin struggling to stay above the 200-day moving average (SMA), currently sitting near $109,800. This key line has served as a dynamic support throughout 2025, and a decisive break below it could accelerate bearish sentiment.
Bitcoin Price Analysis: Key Levels to Watch
The $BTC/USD daily chart paints a clear picture of fragility. After multiple failed attempts to reclaim $111,000–$112,000, sellers have regained control. Momentum indicators are also turning bearish:
- RSI (Relative Strength Index) sits near 40, signaling fading buying pressure.
- MACD lines remain below zero, hinting that momentum could continue to tilt downward.
- The 50-day MA is trending below the 200-day SMA, a potential bearish crossover formation in progress.
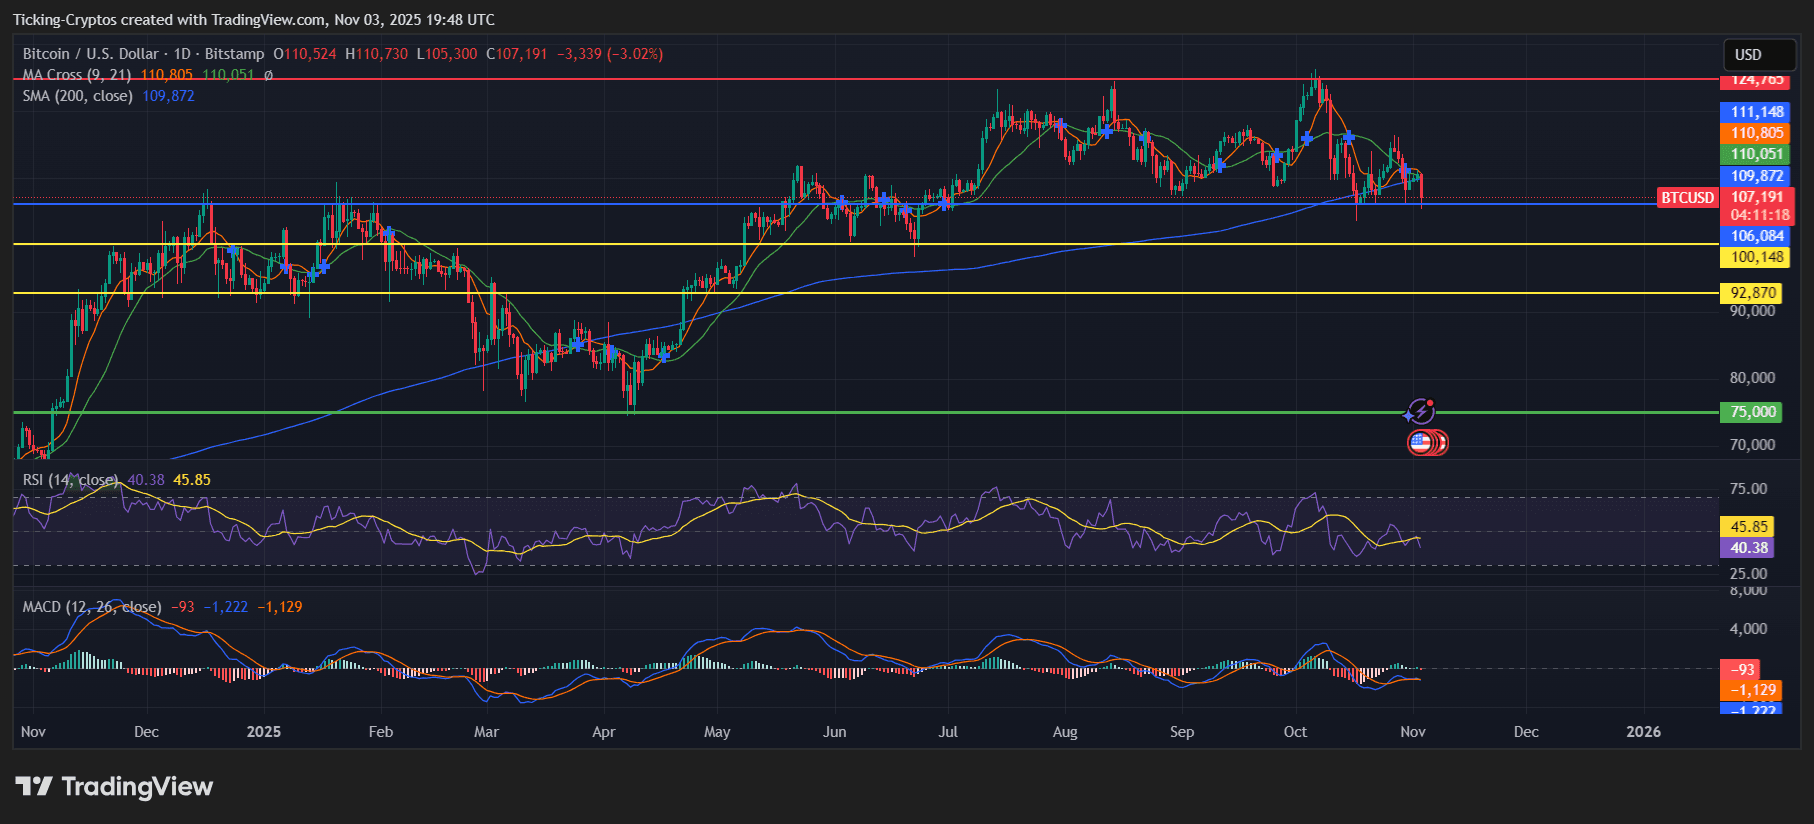
BTC/USD 1-day chart - TradingView
If $Bitcoin closes decisively below $107,000, a critical psychological threshold, a cascade of stop-loss orders could trigger further downside.
Short-Term Bitcoin Prediction If Bitcoin Breaks Below 107K
If the 107K support gives way, the next key zones to watch are:
| Support Level | Zone Description | Probability Impact |
|---|---|---|
| $106,000 | Minor horizontal support from June swing lows | ⚠️ High |
| $100,000 | Psychological round number and prior breakout level | 🔥 Very High |
| $92,800 | Historical confluence from February consolidation | ⚠️ Moderate |
| $75,000 | 2024 support floor and long-term bullish defense line | 🧊 Low (unless panic selling) |
A drop toward $100K would confirm a medium-term correction phase, wiping out nearly all gains made during the summer rally. A breach below $92,800 could then open the door for a deeper capitulation toward $75K, where Bitcoin last found strong buying interest in early 2024.
Bullish Bitcoin Prediction: Can Bitcoin Recover from Here?
For bulls, hope isn’t entirely lost. Bitcoin remains inside a long-term ascending channel and is still above last year’s average range. To invalidate the bearish outlook, BTC must reclaim $111,000, followed by a daily close above $116,000 to reestablish higher highs.
Until then, the market remains vulnerable. The technical structure suggests traders should monitor the $107K–$100K zone closely, as any breakdown could trigger volatility across the broader crypto market.


