


Get the best data-driven crypto insights and analysis every week:
Making Sense of Bitcoin’s Changing Market Rythm
Key Takeaways:
Bitcoin’s supply is turning over more gradually as long-term holders distribute in waves and new participants absorb supply, showing a more measured transition of ownership.
Spot Bitcoin ETFs and Strategy alone have absorbed nearly 90% of the rise in short-term holder supply since early 2024, and now account for 23% of all BTC active within the past year.
Realized volatility continues to stabilize, pointing to a more mature market structure defined by institutional demand and elongated cycle rhythms.
Introduction
After reaching all-time highs earlier this year, Bitcoin has largely been in a consolidation phase, briefly slipping below $100K for the first time since June. A combination of macroeconomic headwinds, weakness in equities and one of the largest crypto liquidation events dampened sentiment and slowed inflows, prompting questions about the sustainability of the bull market. Adding to this, a growing fears have emerged around large holders or “OG whales” moving or selling early coins, putting pressure on BTC and the broader crypto market, which now sits near $3.6T following recent declines.
Beneath the surface, Bitcoin’s on chain data adds important context. In this week’s issue of Coin Metrics’ State of the Network, we explore how shifts in Bitcoin holder behavior and key drivers of demand are influencing sentiment and defining the rhythm of this cycle. By analyzing shifts in active supply, and avenues of demand, we look into whether recent movements reflect end-of-cycle profit-taking, or a more structural transition of Bitcoin’s ownership base.
Supply Distribution Meets Institutional Absoprtion
Active Supply
First, we take a look at Bitcoin’s active supply, which provides a view into age-based activity of its units, segmented based on the duration of last on-chain movement. This contextualizes how supply is distributed between inactive (dormant) coins and those that have moved more recently (also referred to as “HODL Waves”).
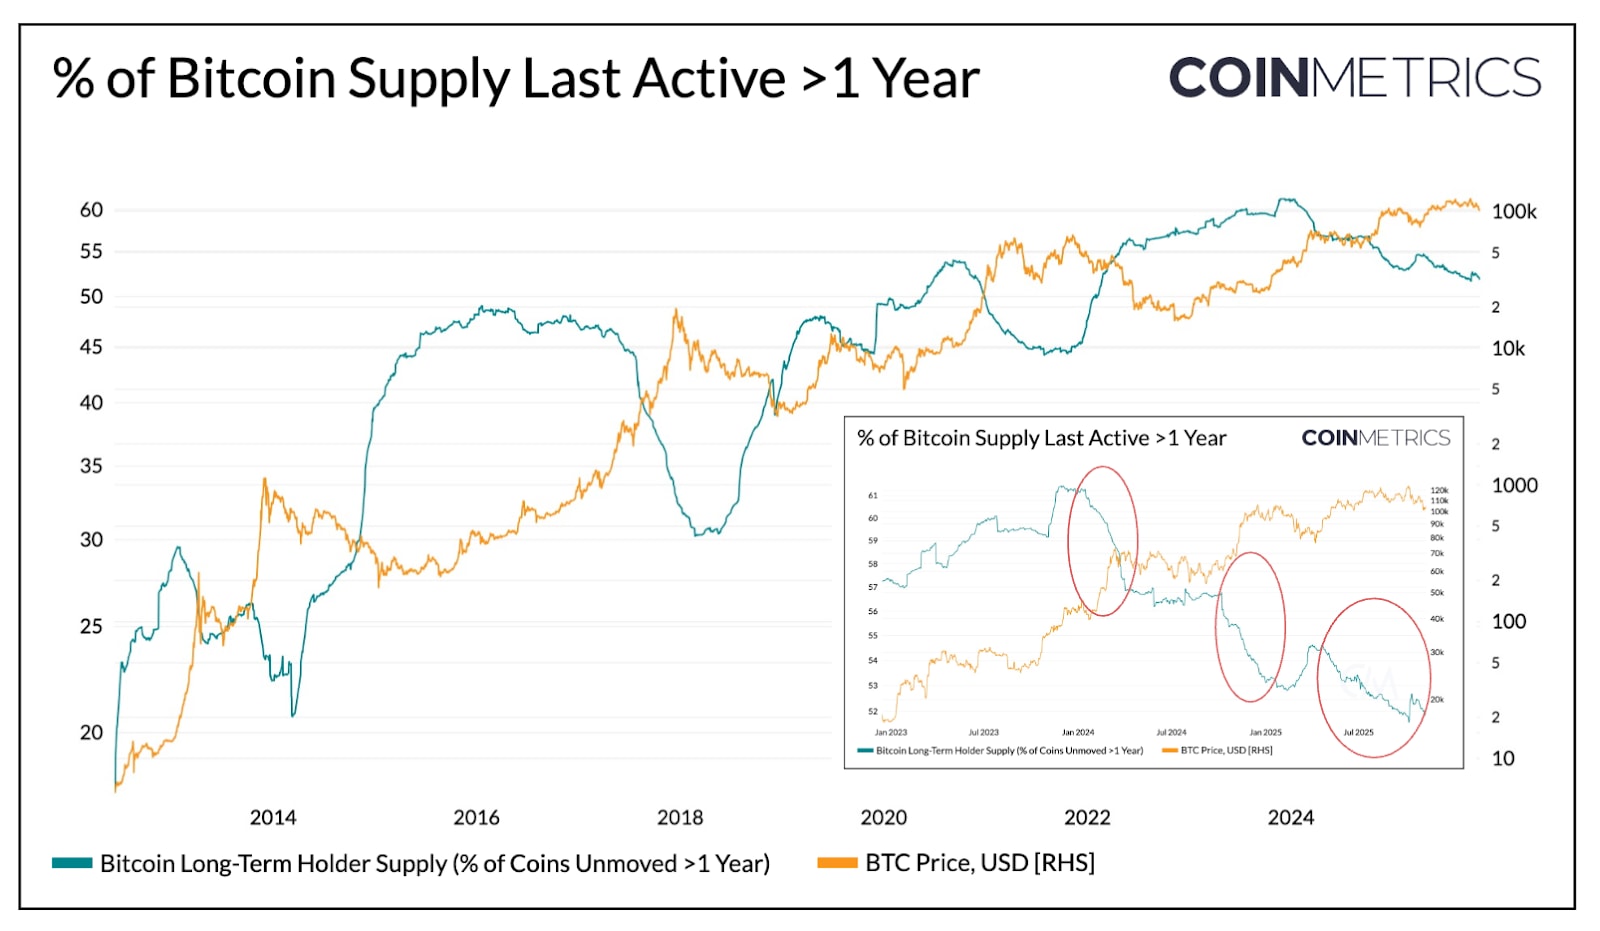
Below, we isolate the portion of Bitcoin’s supply that hasn’t moved for over one year, a proxy for long-term holder supply (LTH). Historically, this rises through bear markets as coins consolidate into long-term holders, and declines as those holders begin to move their coins, realize profits and distribute into strength during bull markets.
Source: Coin Metrics Network Data Pro
Today, roughly 52% of Bitcoin’s 19.94M circulating supply has remained inactive for over a year, down from about 61% in early 2024. Both the magnitude of increases during bear markets and decreases during bull markets has noticeably moderated, with gradual waves of distribution occurring in Q1 2024, Q3 2024 and more recently in 2025. This suggests that long-term holders are distributing in a more sustained manner, reflecting a more extended transition of ownership.
ETFs & DATs as Drivers of Demand
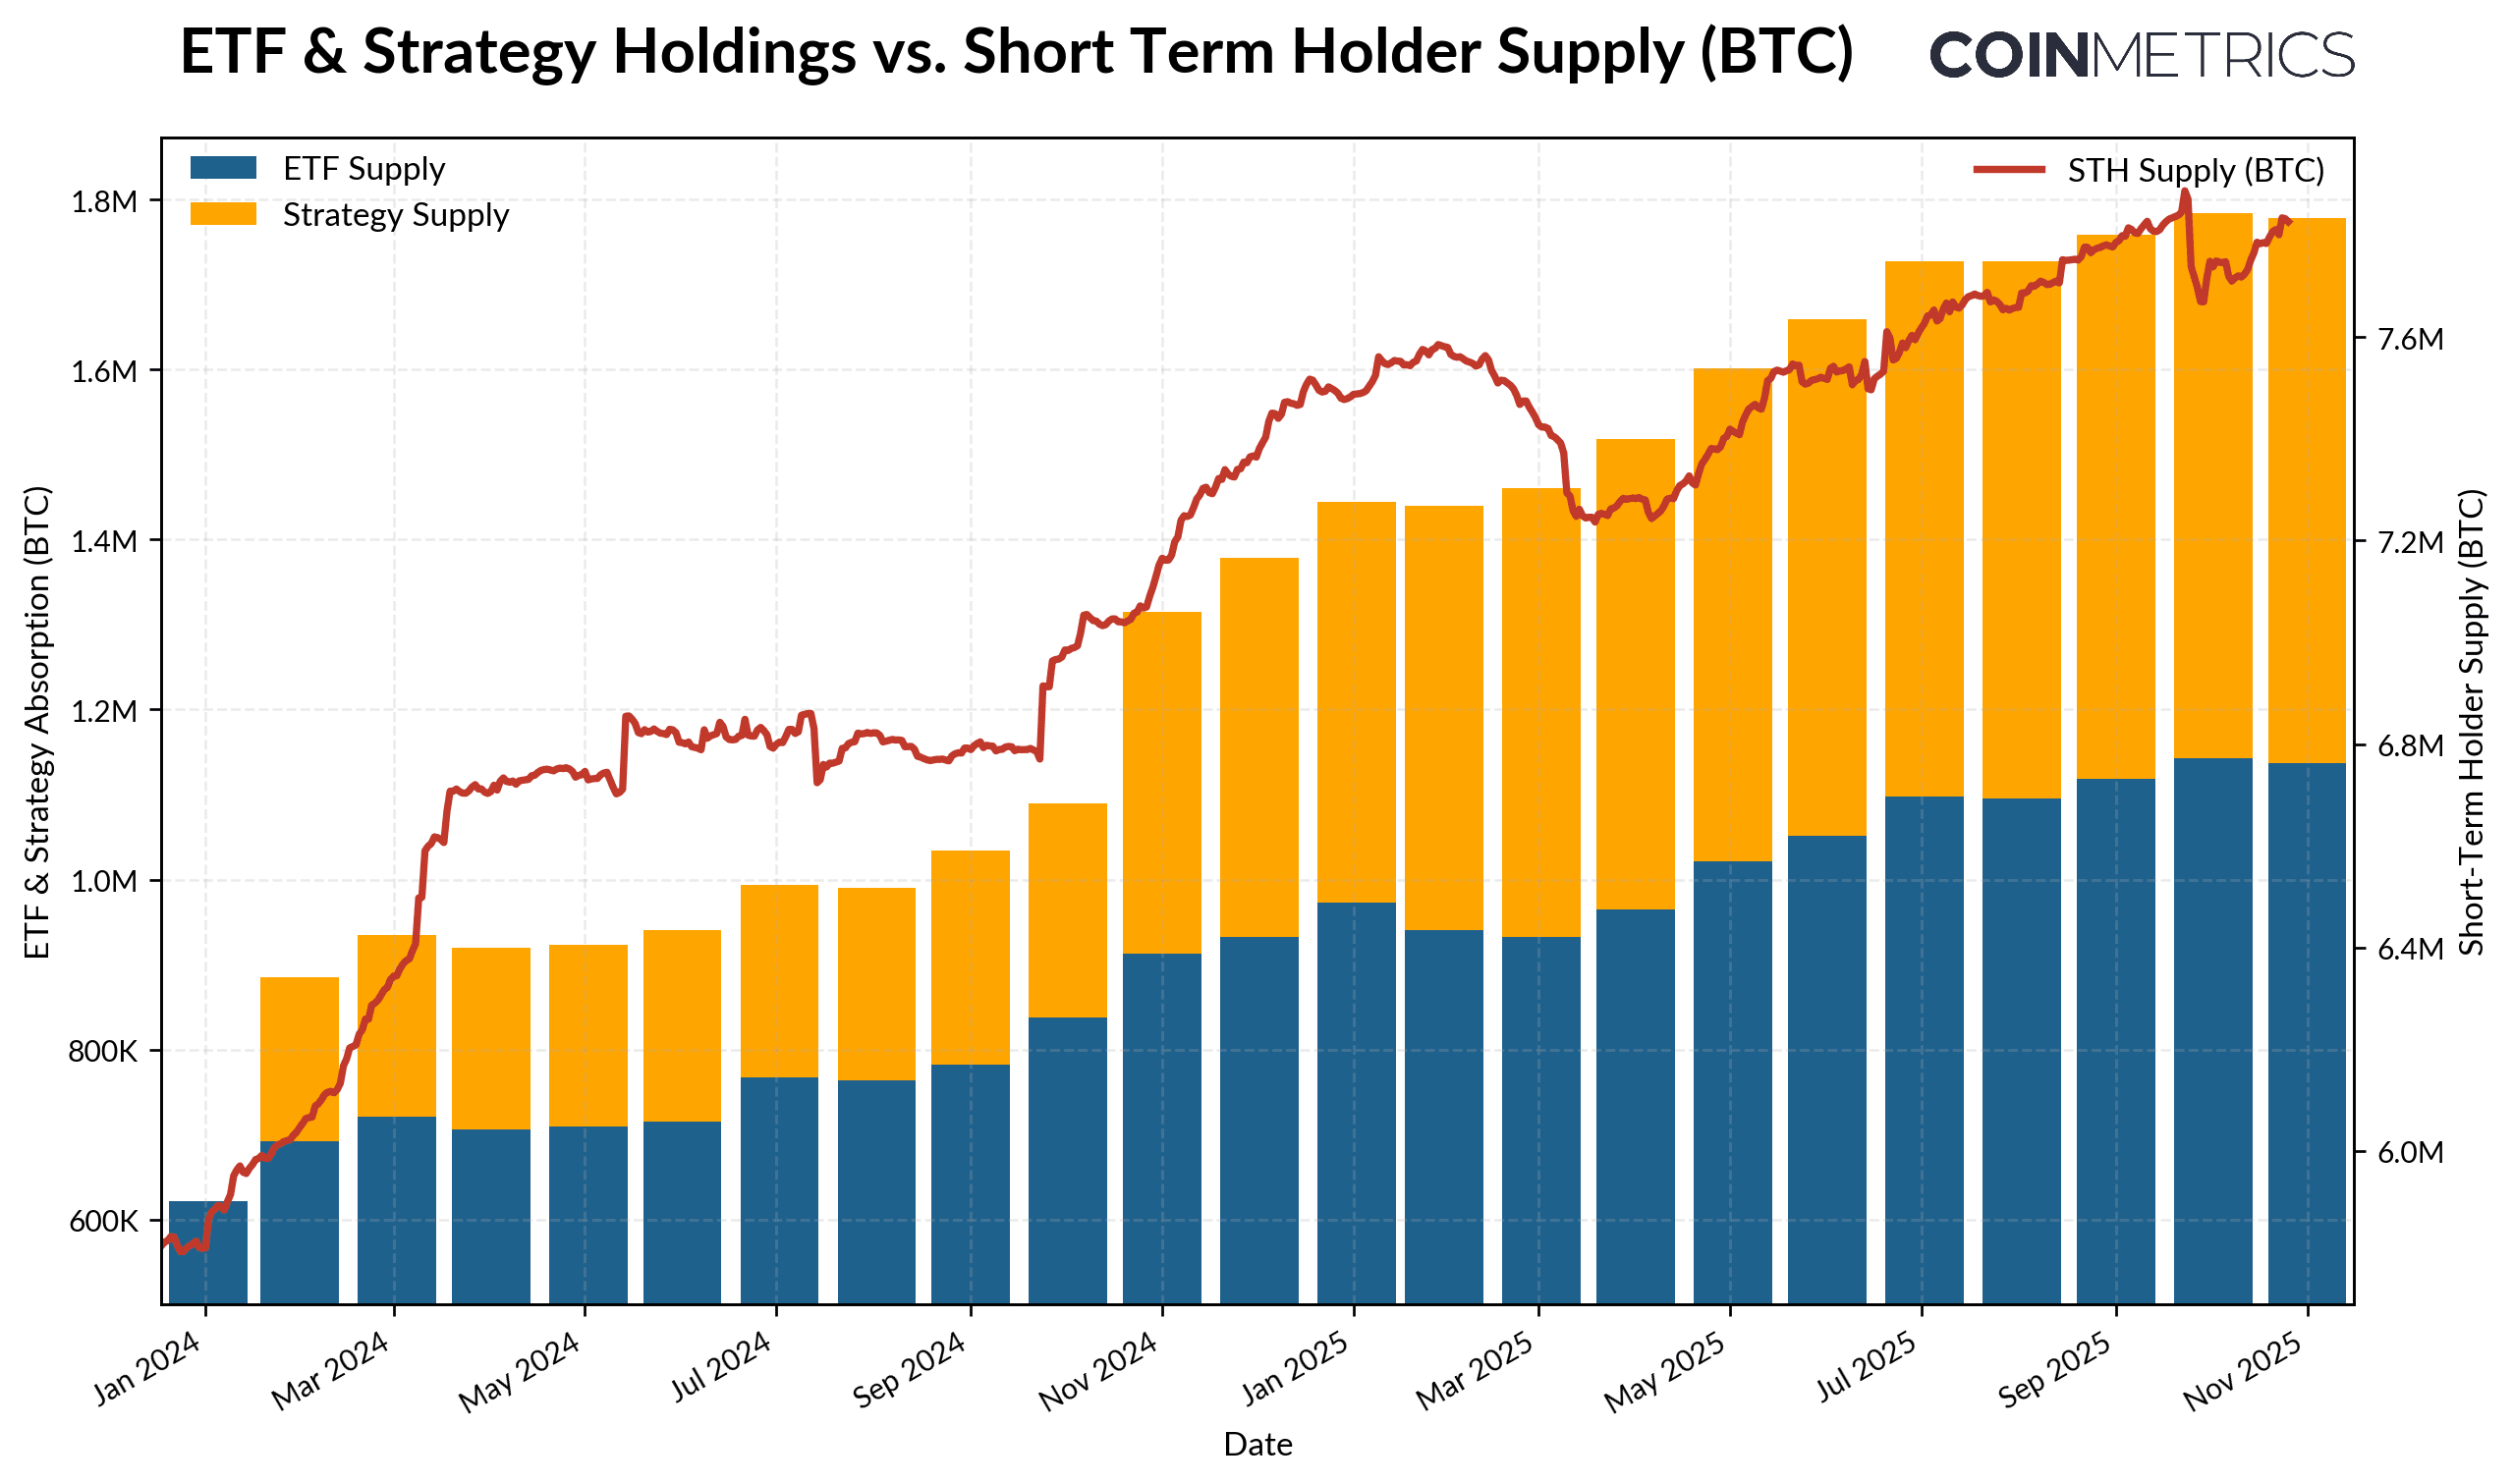
Conversely, short-term holder supply (coins active within the past year) has steadily risen since 2024, as previously dormant coins re-enter circulation. This has coincided with the launch of spot Bitcoin ETFs and the acceleration of Digital Asset Treasuries (DATs) accumulation, both of which have introduced new, persistent channels of demand that are absorbing redistributed supply.
As of November 2025, 7.83M BTC has been active within the past year, up from 5.86M BTC at the start of 2024, an increase of roughly 34% as previously dormant coins re-entered circulation. Over the same period, spot Bitcoin ETFs and Strategy’s treasury holdings have expanded from around 600K BTC to 1.9M BTC, absorbing nearly 90% of the net increase in short-term holder supply. Together, these vehicles now account for about 23% of all short-term holder supply.
Although inflows have tapered in recent weeks, the broader trend reflects a gradual shuffling of supply into more stable, long-horizon channels of ownership, a unique feature of this cycle’s market structure.
Source: Coin Metrics Network Data Pro & Bitbo Treasuries (Note: ETF supply does not include Fidelity’s FBTC and DAT supply includes Strategy)
Short Term & Long Term Holder Behavior
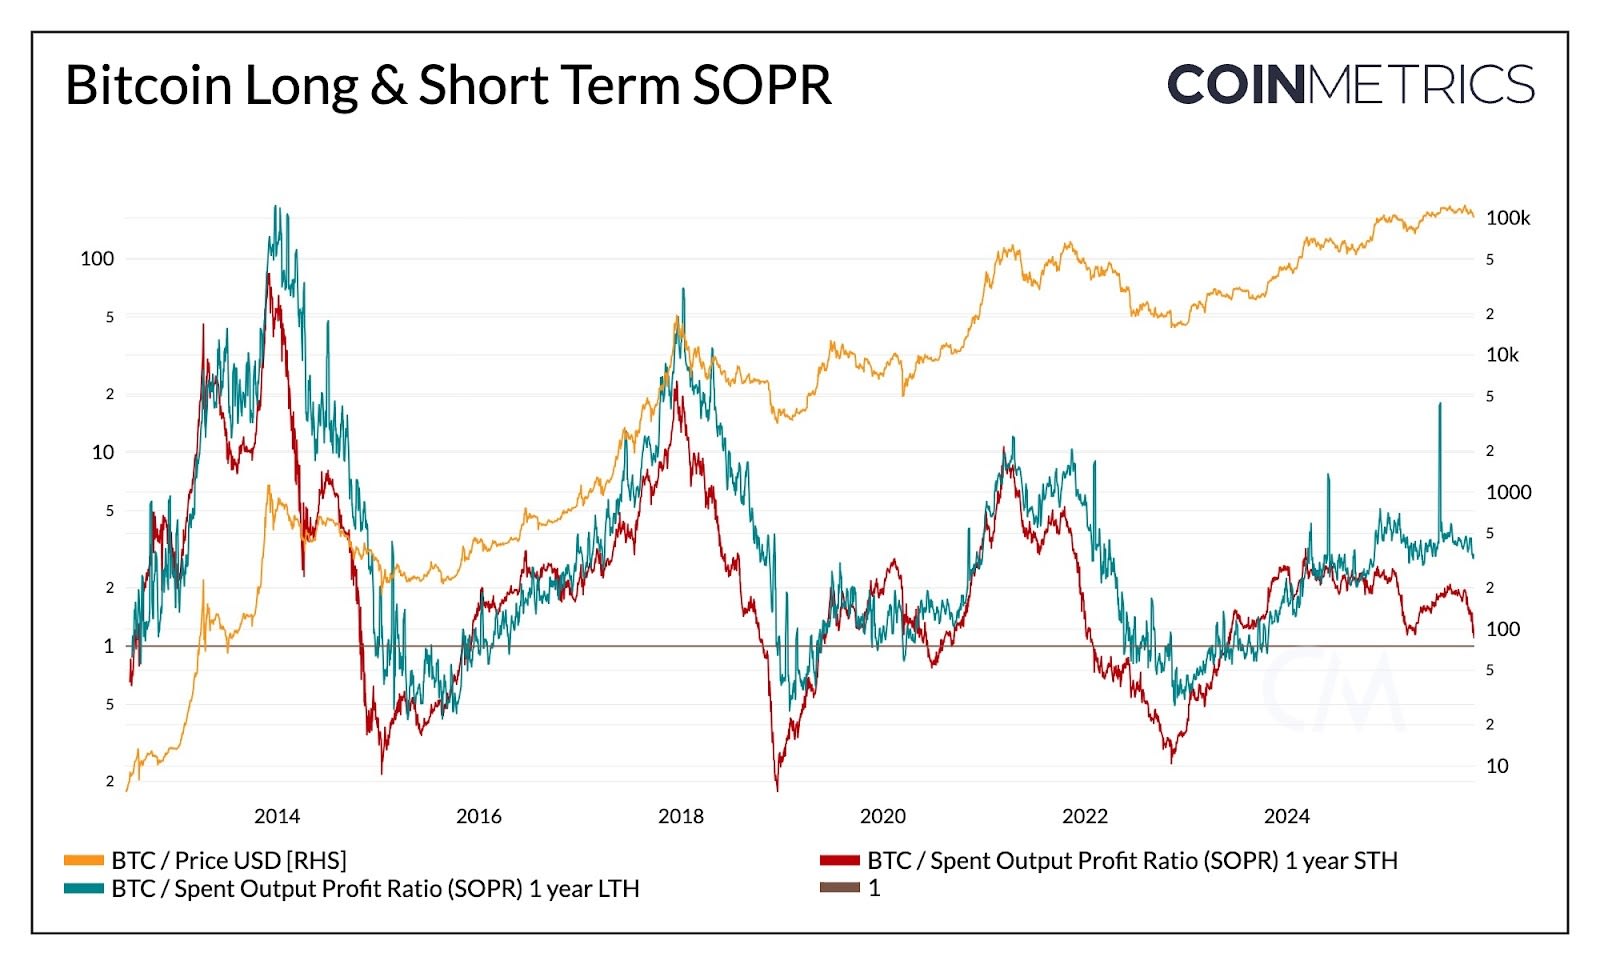
Realized profitability trends reinforce the pattern of moderation seen in Bitcoin’s supply dynamics. The Spent Output Profit Ratio (SOPR), which measures whether holders are spending coins at a profit or loss, provides a lens into how different holder cohorts behave across market cycles.
In prior cycles, both long and short-term holders tended to realize profits and losses in sharp, synchronized swings. More recently, this relationship has diverged. Long-term holder SOPR remains modestly above one, suggesting steady profit realization and measured distribution into strength.
Source: Coin Metrics Network Data Pro
Short-term holder SOPR has hovered near breakeven, explaining some of the recent caution in market sentiment, as many short-term holders sit near their cost basis. The divergence between cohorts reflects a more tempered phase of the market, where institutional demand absorbs redistributed supply rather than seeing rapid booms and busts of the past. A sustained move of short-term SOPR above 1 could be a confirmation of stregnthening momentum.
While a broader pullback would still compress profitability across cohorts, the general pattern points to a more balanced structure in which supply turnover and profit realization unfold gradually, extending Bitcoin’s cycle rhythm.
Bitcoin’s Dampening Volatility
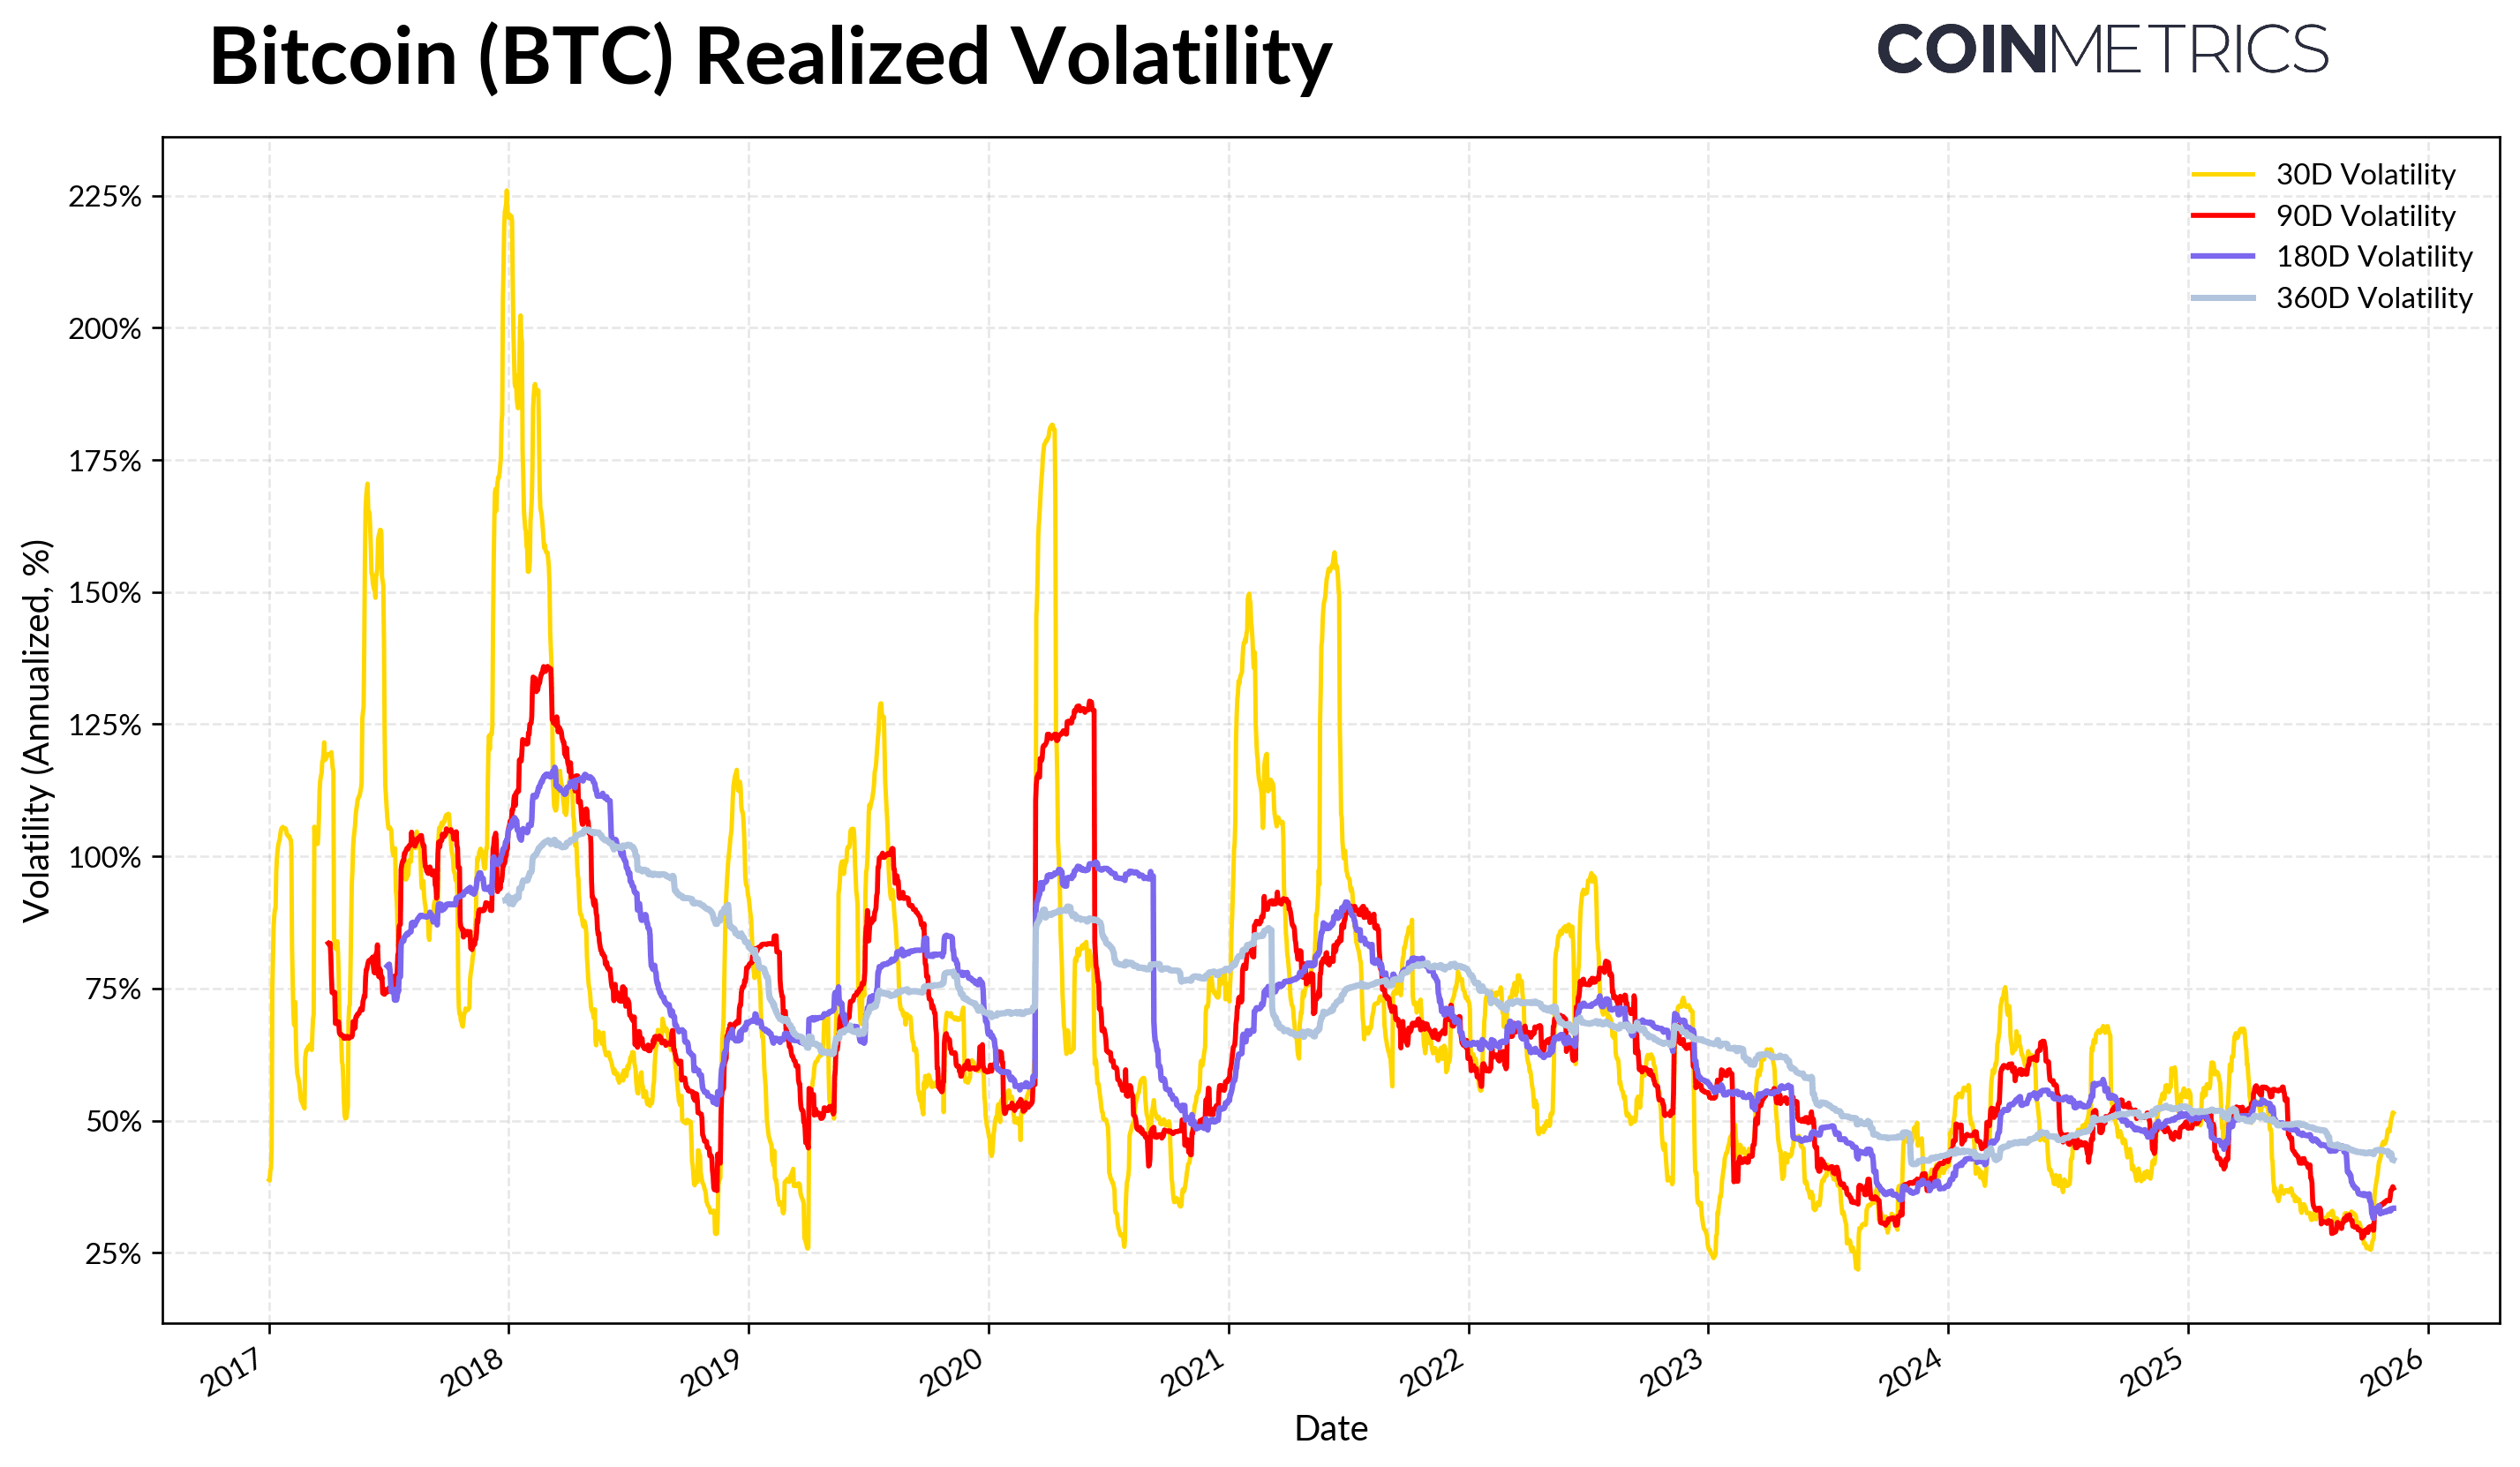
This structural moderation is also visible in Bitcoin’s volatility profile, which has continued to trend lower over time. Bitcoin’s realized volatility over 30, 60, 180 and 360 days has stabilized near 45-50% compared to its more explosive past that drove pronounced boom-and-bust cycles. Today, Bitcoin’s volatility profile increasingly resembles that of large-cap technology equities, suggesting its maturity as an asset. This reflects both improved liquidity and a more institutionally anchored investor base.
For allocators, this dampening volatility may increase BTC’s appeal in portfolios, particularly as correlation with macro assets like equities and gold remains dynamic.
Source: Coin Metrics Market Data Pro
Conclusion
Bitcoin’s on-chain trends suggest that this cycle is unfolding through more tempered, prolonged phases, without yet showing the euphoric blowoffs seen in prior bull markets. Supply distribution is happening in waves, and much of it is being absorbed by more durable channels of demand, ETFs, DATs, and broader institutional ownership. This transition points to a more mature market structure where volatility and velocity is dampening, and cycles are elongating.
That said, momentum still hinges on sustained demand. The flattening of ETF inflows, pressure on some DATs, recent market-wide liquidations, and breakeven-level SOPR readings among short-term holders all highlight a market in recalibration. A sustained rise in long-term holder supply (coins inactive for over a year), SOPR climbing above 1, and renewed inflows into spot Bitcoin ETFs and stablecoins could serve as key signals of returning strength.
Looking ahead, easing macro uncertainty, improved liquidity conditions, and regulatory developments around market structure could help reaccelerate inflows and extend the bull market. While sentiment has cooled, markets remain on a healthier footing following recent deleveraging resets, underpinned by growing institutional channels and the adoption of on-chain infrastructure.
Coin Metrics Updates
Follow Coin Metrics’ State of the Market newsletter which contextualizes the week’s crypto market movements with concise commentary, rich visuals, and timely data.
As always, if you have any feedback or requests please let us know here.
Subscribe and Past Issues
Coin Metrics’ State of the Network, is an unbiased, weekly view of the crypto market informed by our own network (on-chain) and market data.
If you’d like to get State of the Network in your inbox, please subscribe here. You can see previous issues of State of the Network here.


