

Zcash (ZEC) price has fallen over 20% in the past 24 hours, sparking worries that the rally could be cooling off. But zoom out, and the picture looks very different. Zcash price is still up 14% this week and over 1,200% in the past three months — one of the strongest performers of the cycle.
The dip might not be a reversal. It might be the setup for the next leg higher. Here is why!
Price Consolidates, Yet Forms a Bull Flag
ZEC price seems to be consolidating inside a bull flag, a technical pattern that usually appears after a sharp rally. The surge from late October to early November created the flagpole, and the current sideways movement has built the flag — a structure that often leads to continuation once the upper line breaks.
What makes this setup stronger is a hidden bullish divergence on the daily chart. Between November 8 and 10, ZEC formed a higher low while the Relative Strength Index (RSI) — which measures momentum — made a lower low.
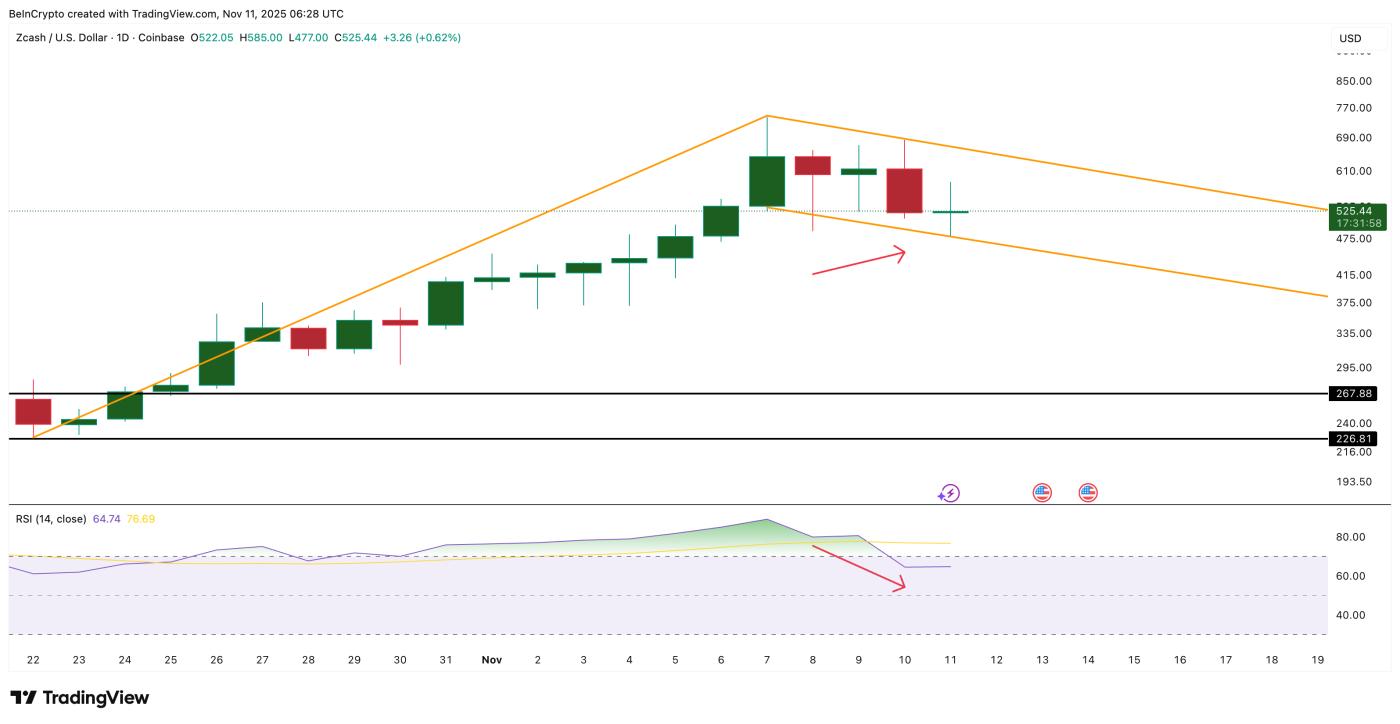 Zcash Flashes Bullish Signs: TradingView
Want more token insights like this? Sign up for Editor Harsh Notariya’s Daily Crypto Newsletter here.
That usually means selling pressure is fading even as the price holds steady. In short, the correction might just be clearing weak hands before the next push. It is worth noting that hidden bullish divergence usually points to trend continuation. And that’s positive for the ZEC price.
However, if the newest candle closes in red, it would invalidate the hidden bullish divergence with the price forming a set of lower lows. That could delay the breakout hypothesis.
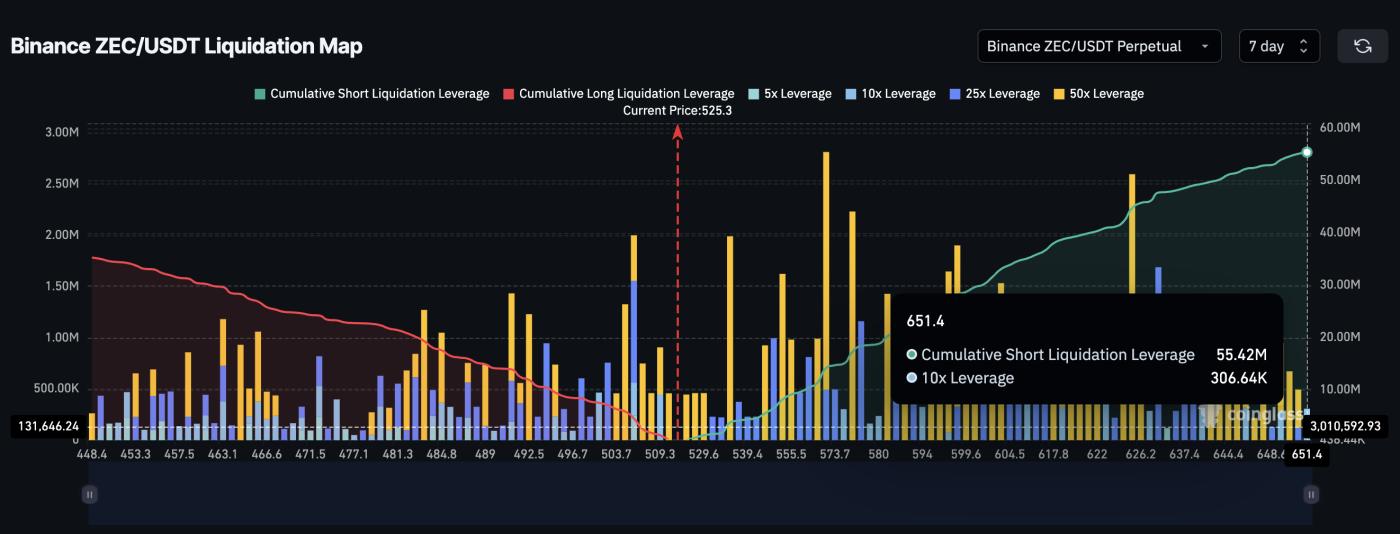
Leverage Data Hints at a Brewing Short Squeeze
Derivatives traders may be setting the stage for ZEC’s next move. Even a breakout if things go well.
The liquidation map — a chart showing where leveraged positions could get wiped out — highlights a short-heavy zone between $529 and $651. Short positions on Binance alone total about $55.42 million, roughly 60% higher than the $35.3 million in long exposure.
 Liquidation Map Is Short-Biased: Coinglass
That imbalance creates a short squeeze setup. If ZEC’s price climbs even modestly, short traders could be forced to buy back positions, adding fresh momentum to the move.
This squeeze zone sits close to the bull flag resistance, giving extra fuel for a ZEC price breakout attempt.
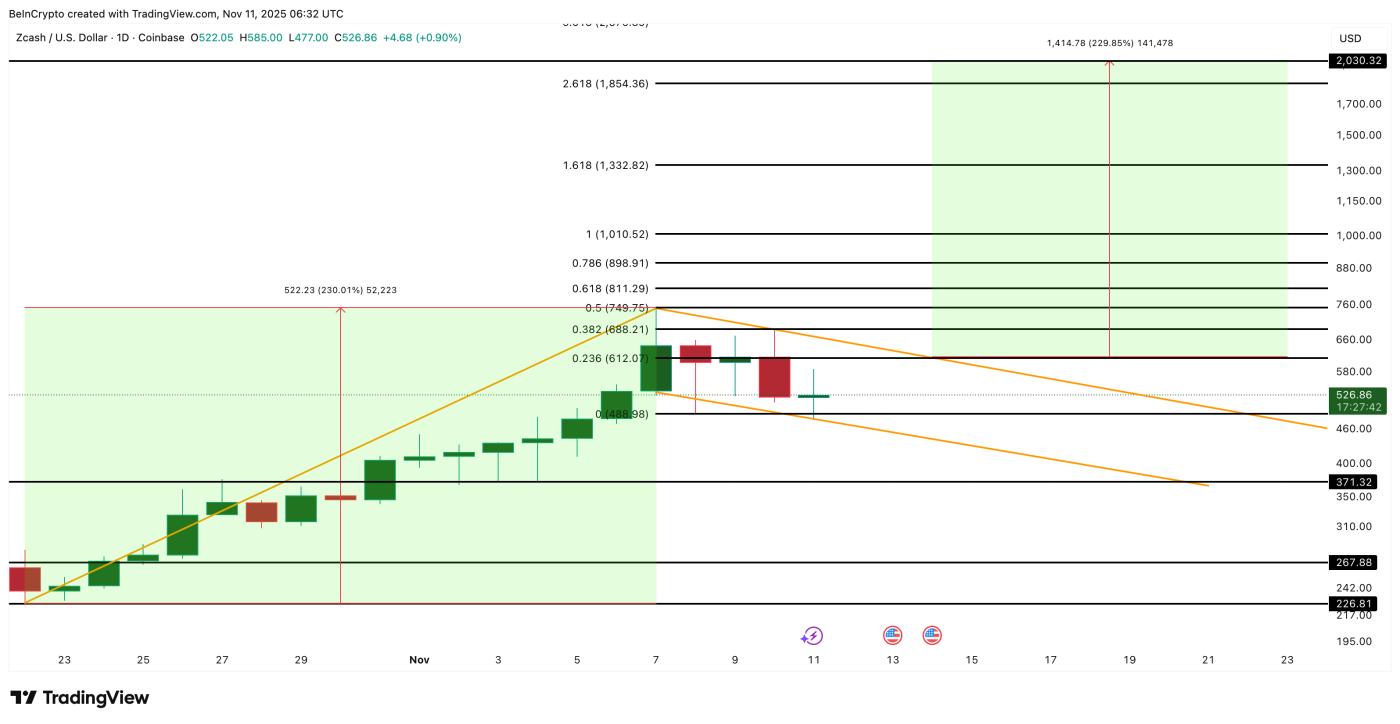
Zcash Price Targets a Breakout Above $688
At writing, ZEC trades around $526, mostly midway through its consolidation range.
A breakout above $612-$688 would confirm the flag pattern and could trigger an upside run toward $749, $898, and $1,010. If momentum stretches further, the full flagpole projection suggests a potential 230% upside, which could push ZEC close to $2,030 over time.
 Zcash Price Analysis: TradingView
Still, the setup hinges on one condition: the price must stay above $488. A clean drop below that would invalidate the bull flag and invite a deeper pullback toward $371.
For now, though, Zcash’s chart looks more like a recharge than a retreat. And if this pattern plays out, the 20% correction might just have lit the fuse by putting the price action inside the flag.


