

While total market Capital entered its fourth consecutive week of decline and the market lost nearly $1 trillion in November, the data shows a notable difference in how investors are pulling Capital . Medium and small- Capital assets showed surprisingly positive signals.
What is this signal and what does it mean in the current context? The following report provides a detailed explanation.
3 positive signals for altcoins when the market becomes most pessimistic
The market sentiment index has been in a state of “extreme fear” for most of November. However, some positive signals have emerged, such as rays of hope for altcoins.
First, a report from CryptoQuant compares the market Capital performance of Bitcoin, large- Capital coins, and mid- and small- Capital altcoins. The report shows significant resilience in the low Capital segment.
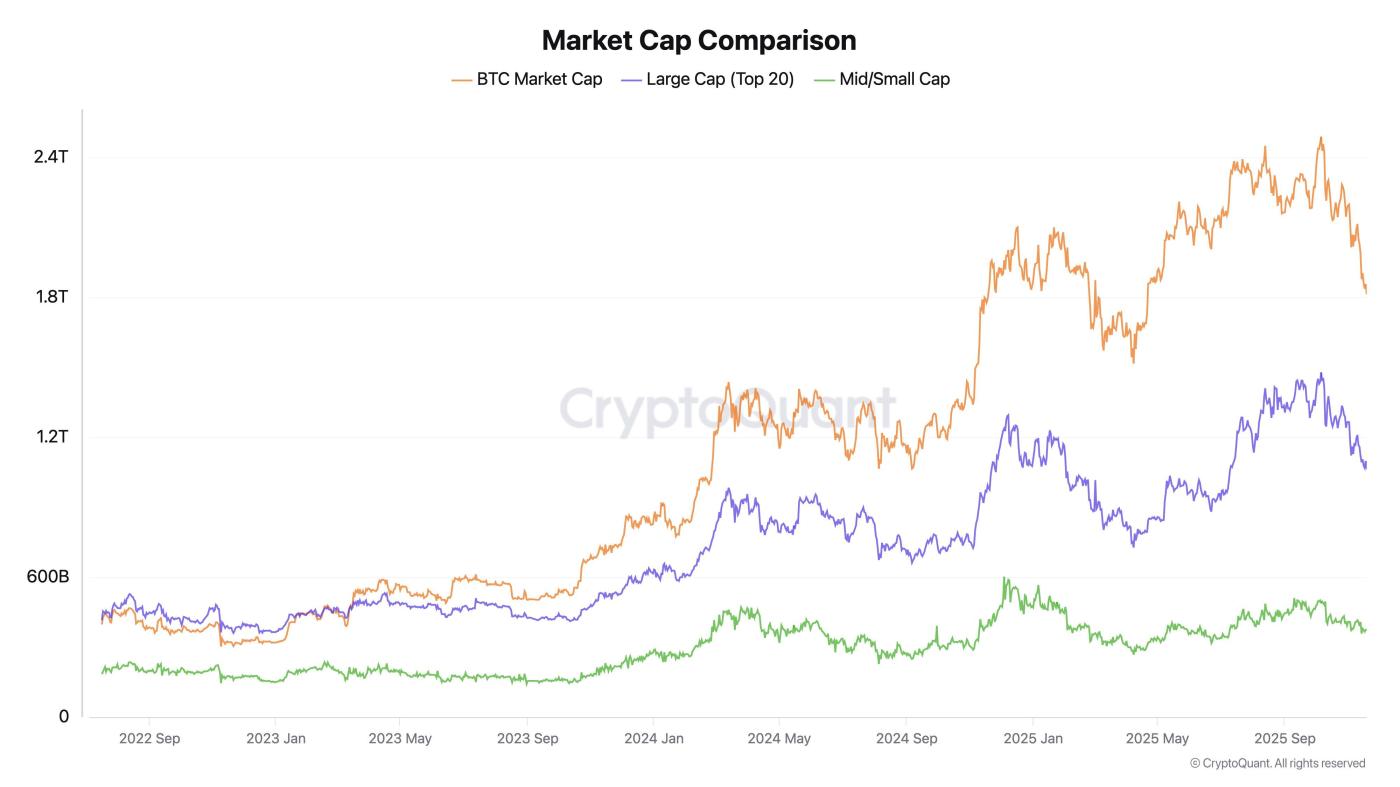 BTC and Altcoin market Capital comparison. Source: CryptoQuant .
According to the market Capital comparison chart, Bitcoin experienced the sharpest decline in November. Large-cap Capital , including the top 20 altcoins, also fell, but less. Medium and small-cap Capital only fell slightly and suffered little damage.
“Large Capital are struggling, but not as much as BTC, while mid-small Capital are showing real resilience,” analyst Darkfost commented .
In fact, the chart shows that only Bitcoin and large- Capital market Capital have reached new all-time highs. Mid- and low- Capital assets have yet to return to their late-2024 peaks. From a psychological perspective, when altcoins fall too far — often losing 80–90% of their value — holders often view their assets as “lost.” They have less incentive to panic sell.
This leads to the second notable factor: the difference between Bitcoin Dominance and OTHERS Dominance.
Bitcoin Dominance (BTC.D) measures Bitcoin's share of total market Capital . OTHERS Dominance ( OTHERS.D) measures the market share held by all altcoins except the top 10.
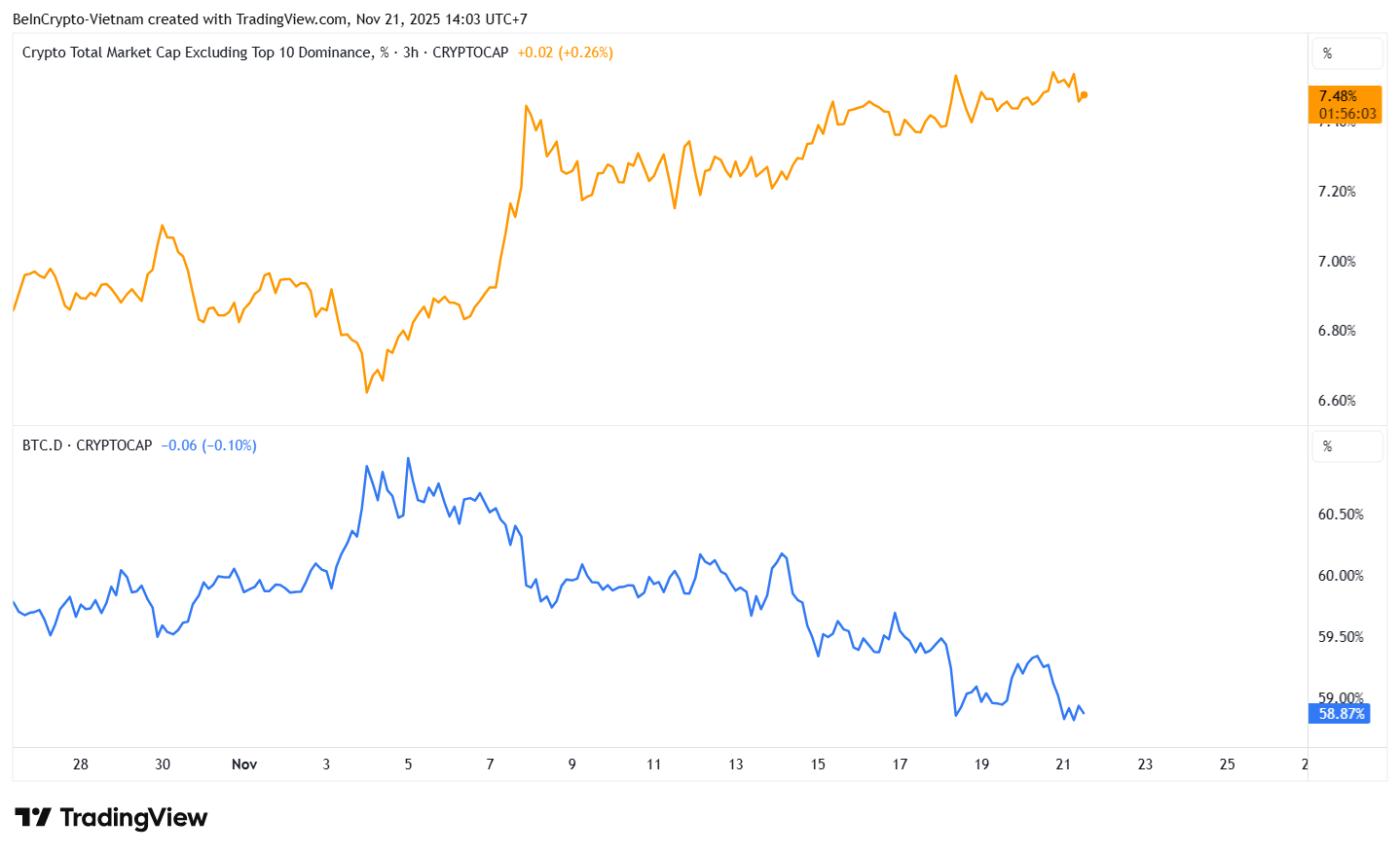 Bitcoin Dominance and OTHERS Dominance. Source: TradingView
The chart shows that in November, OTHERS.D increased from 6.6% to 7.4%. Meanwhile, BTC.D decreased from 61% to 58.8%.
This difference shows that altcoin investors are no longer prone to panic selling, even at a loss. Instead, they are holding their positions and waiting for a recovery.
History shows that when BTC.D falls and altcoin dominance increases , the market often switches to an altcoin bull cycle .
Additionally, data from Binance shows that 60% of current volume is coming from altcoins, which is the highest level since early 2025.
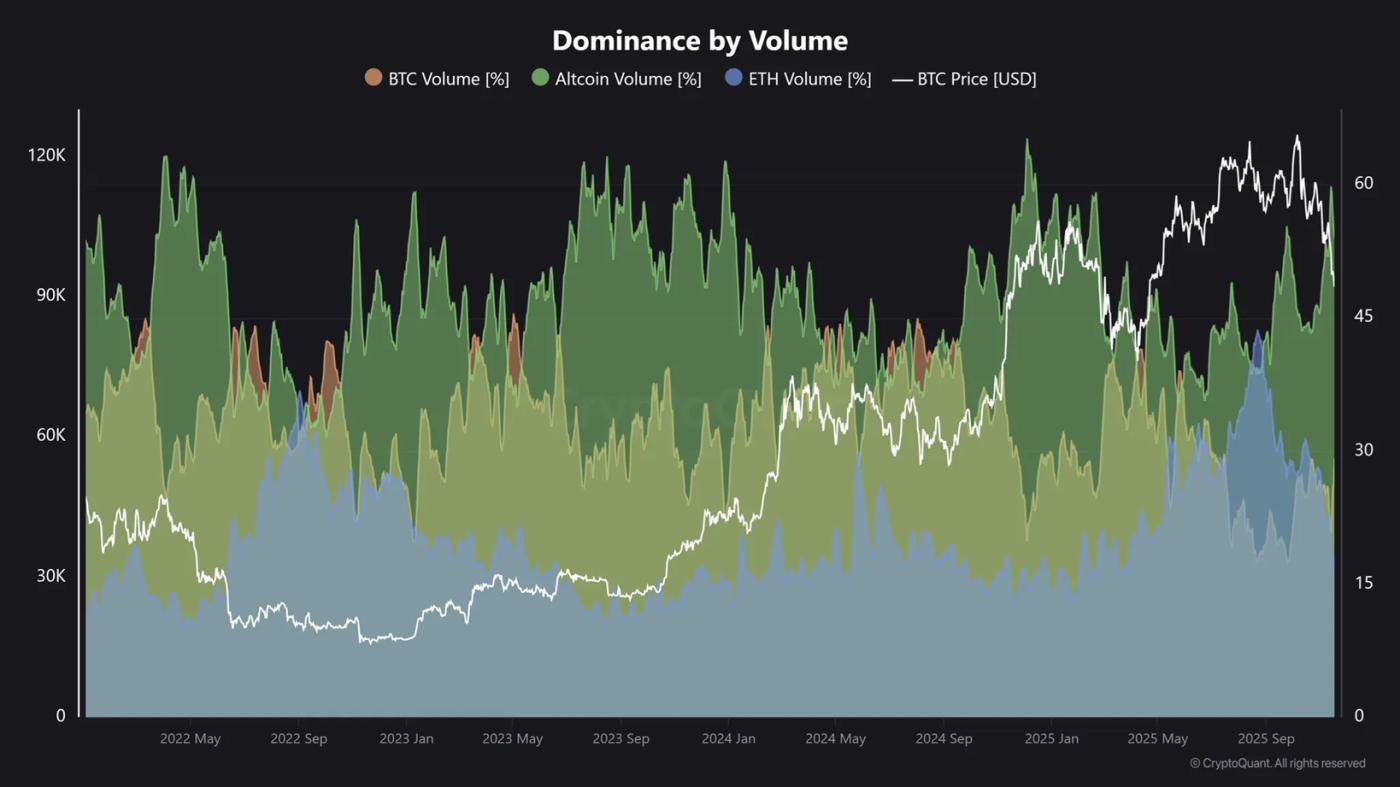 Volume dominance. Source: CryptoQuant .
Analyst Maartunn believes this data highlights where the real trading activity is taking place. Currently, activity is largely concentrated outside of major cryptocurrencies. Altcoins have become a popular means of trading on Binance again.
“History shows that when altcoin volume increases it often coincides with increased speculation in the market,” said maartunn.
In summary, mid- and low-cap Capital are receiving strong liquidation flows. They also show better price performance and higher market share. These factors indicate that altcoin holders have strong expectations for a recovery from the Dip .


