

Zcash price has been flat over the past 24 hours, even as nearly $2 billion in cryptocurrency positions were liquidated in the sell-off. This makes ZEC one of the few coins that has held its ground amid the broader market decline.
The price is still up more than 27% from last week, but a further breakout is not guaranteed unless the price breaks above a key barrier.
Momentum signals reveal sell-off dominance, but risks not over
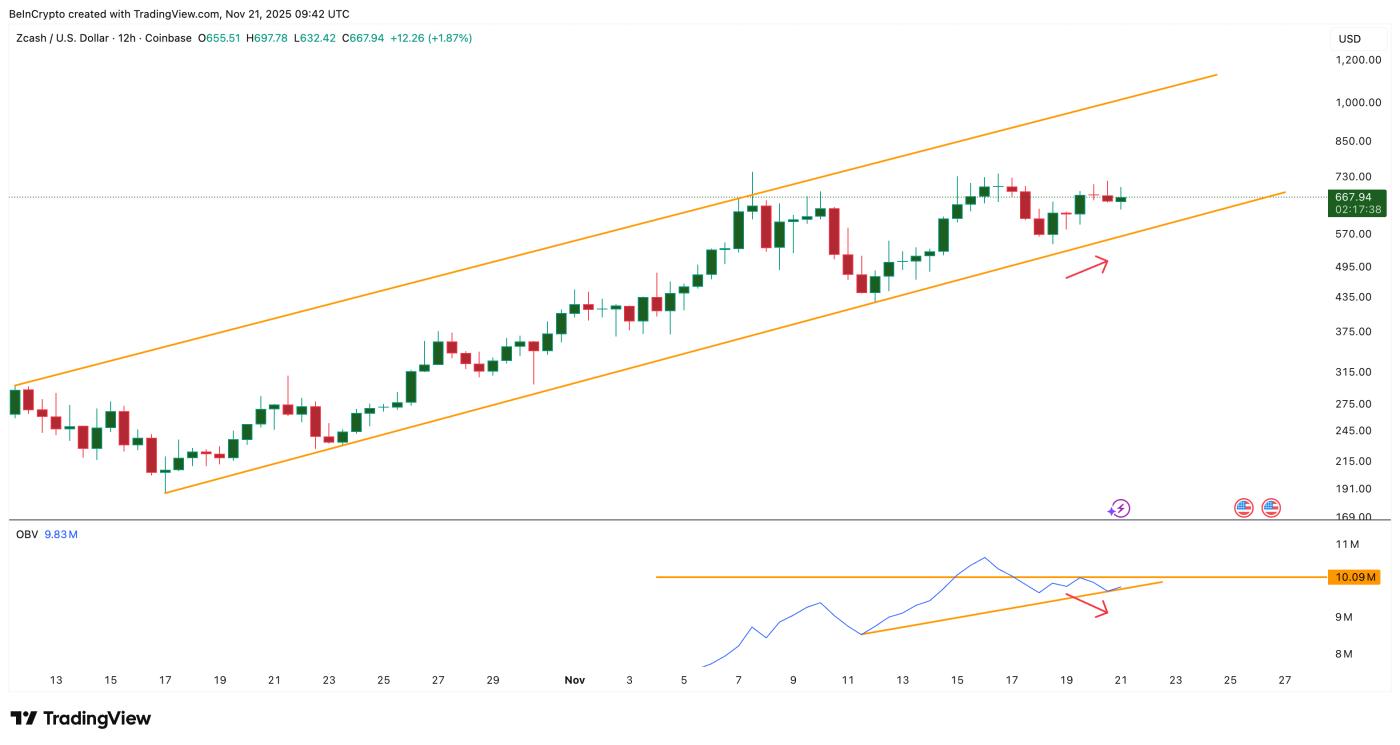
On the 12-hour chart, Zcash continues to move within an ascending channel. The upper trendline has only two touches, so it could be broken easily if momentum improves. However, the breakout theory has encountered some problems in the sell-off, mainly led by three important indicators.
On-Balance Volume (OBV) shows whether real demand is supporting the price. From November 19 to November 20, the price made a higher Dip but OBV made a lower Dip .
This bearish divergence weakens a trend. OBV touched channel support on November 20 and rebounded, avoiding a deeper decline. But ZEC needs OBV to move above 10.09 million to confirm stronger demand.
 Zcash Volume Returns: TradingView
Want more Token news like this? Subscribe to Editor Harsh Notariya's daily Crypto Newsletter here .
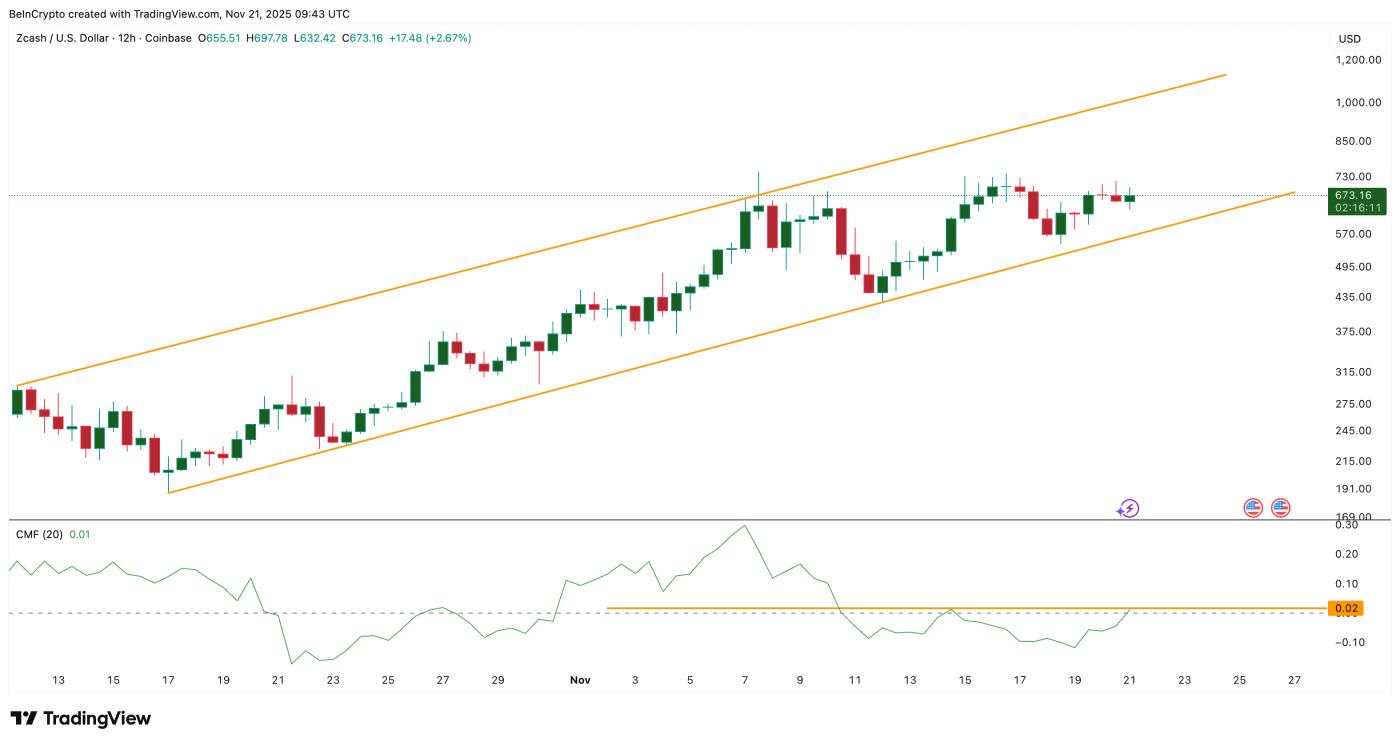
Chaikin Money Flow (CMF), which tracks large money flows, has been declining since November 7, which explains why ZEC has been unable to break above the top of the rising channel.
The CMF briefly crossed above zero on November 14 and helped trigger a bullish Medium. The indicator is currently above the zero line. However, a move above 0.02 would be a strong confirmation that money flows have recovered.
 Big Money Returns: TradingView
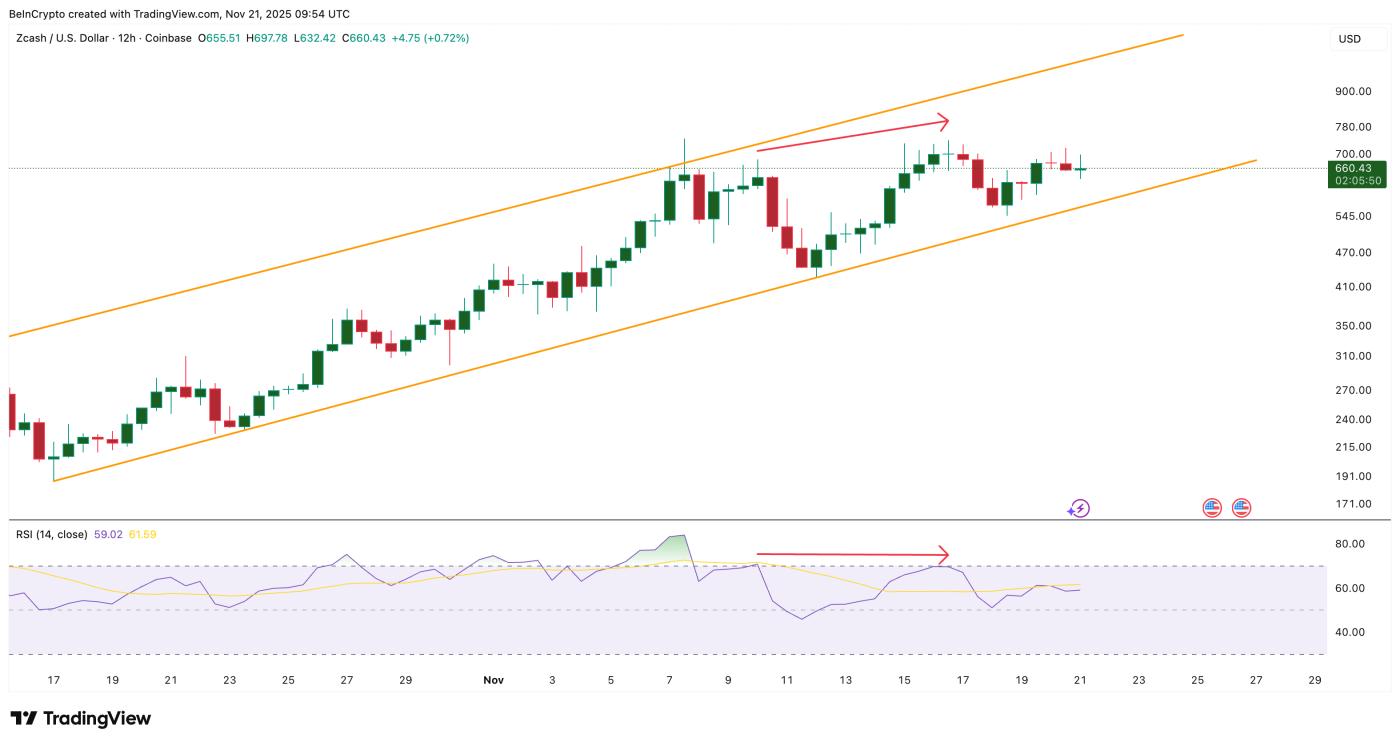
The Relative Strength Index (RSI), a momentum indicator, however, adds a major risk.
From November 10 to November 16, Zcash price made higher highs, but RSI made lower highs. This bearish divergence shows that momentum is weakening as Zcash price moves higher.
 RSI Puts Pressure On Zcash Price Initially: TradingView
This is also where bears are temporarily in control, and this is consistent with the weakness in OBV and CMF. Currently, RSI is moving in tandem with price, indicating that momentum is returning. This is why Zcash “almost” overcame the sell-off instead of flipping into a deeper reversal.
Zcash Price Shows Breakout Battle Still Ahead
The current Zcash price levels decide whether the bulls can take control of the breakout battle or not.
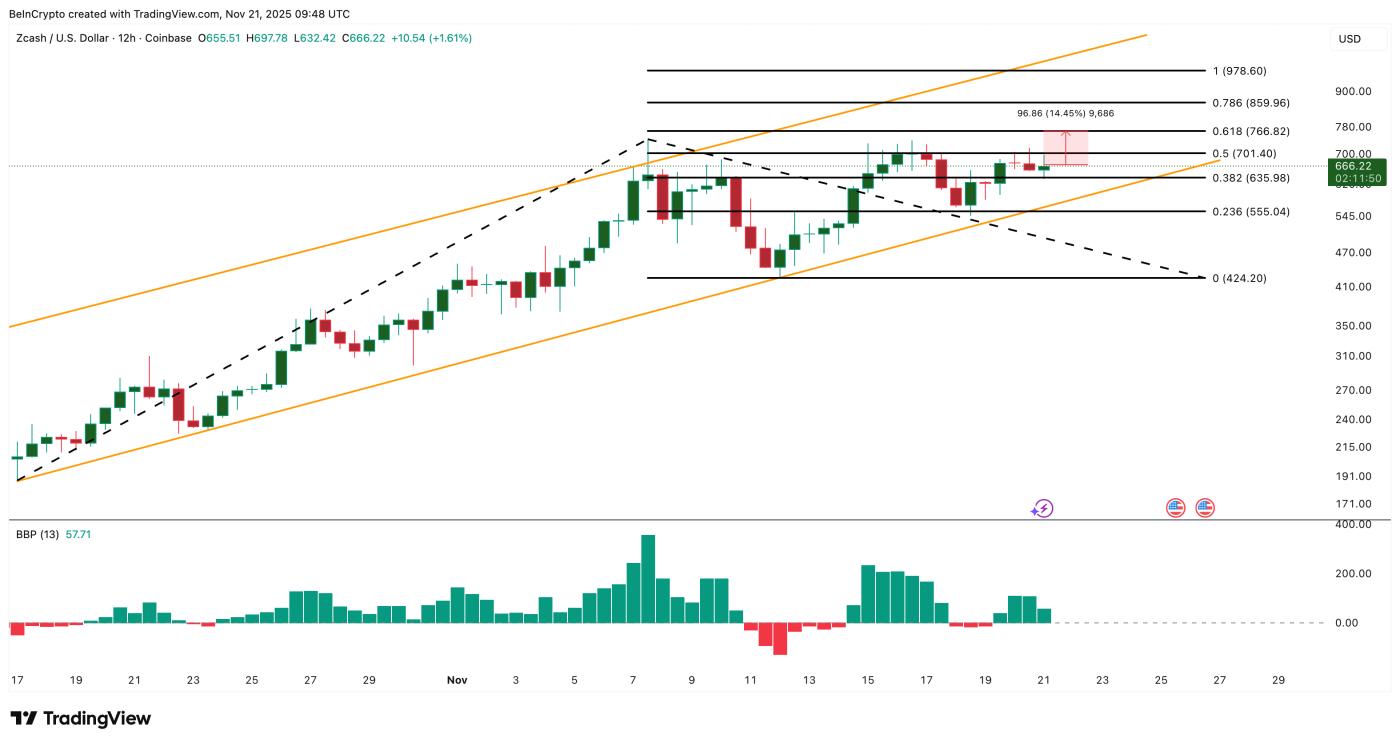
The first major hurdle is $766, the first breakout target. This is the previous trend extension zone where ZEC stopped. Breaking above $766 would signal the first real change in momentum.
If ZEC breaks above $766, the next important target is $978. This level also represents a potential breakout from the ascending channel. A clear move above $978 would open the way to four-digit prices.
 Zcash Price Analysis : TradingView
On the downside, $635 is the first support level. Losing this level would bring $555 closer. A break below $555 would push ZEC out of the uptrend channel and return the trend to neutral. This is where the bull-bear strength indicator comes into play.
The Bull-Bear Position Strength Indicator compares price to the underlying trend value to show who is in control of the short-term power. After the RSI divergence (November 10–16), bears are temporarily in control, consistent with the Medium channel correction.
But the indicator has now turned positive, meaning that the bulls are back in control. Since the bulls are now leading on the bull-bear strength indicator, the breakout battle becomes more heated above $766. If Zcash breaks above $766 while the bull-bear strength remains positive, Zcash has a real chance to attack $978, the crucial breakout level that will determine the next move of the trend.


