

ENA’s price is up more than 10% in the past 24 hours and is trading near $0.28. The move is notable because the Token is still down about 54% in three months, in a steady downtrend. Some traders may XEM this bounce as a sign of a trend change.
But on-chain data and technical signals still point in the opposite direction. The bullish sentiment has not been fully confirmed, and the possibility of a 13% drop remains realistic.
Whales reduce participation while volume and momentum slow
Large holder are not supportive of this move. While some articles on X highlight new whale buying, the overall picture tells the opposite story.
Over the past 24 hours, whale holdings have dropped from 8.17 billion to 8.07 billion ENA. That's a drop of almost 100 million ENA, or about $28 million at current prices.
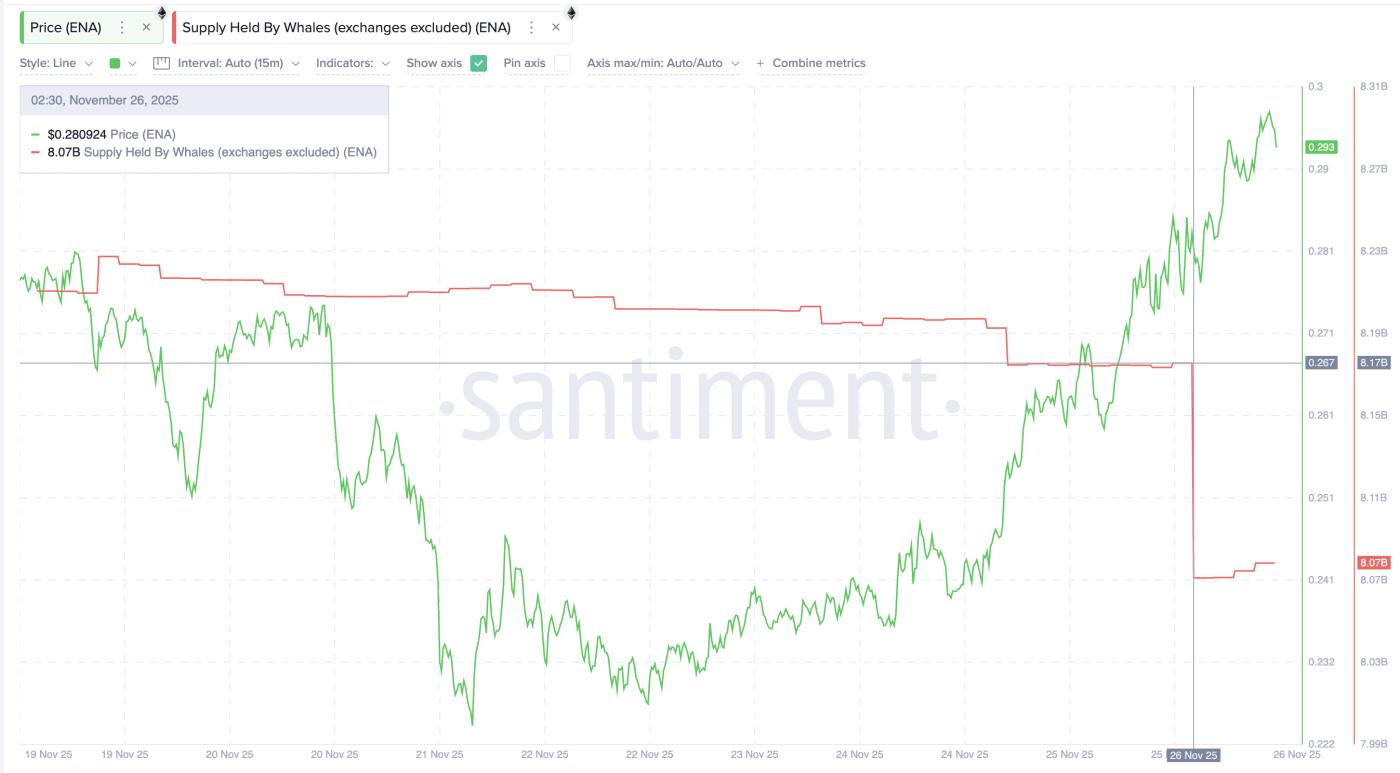 ENA Whales: Santiment
Want more information on Token like this? Subscribe to Editor Harsh Notariya's daily Crypto Newsletter here .
So the bounce is happening while whales continue to trim positions. This weakens the foundation of the rally.
The volume pattern agrees. On-Balance Volume (OBV), which tracks XEM actual buying volume is increasing or decreasing, has formed a clear divergence. From November 18 to November 26, ENA price made a higher high, but OBV made a lower high.
This means that price is rising faster than volume is actually rising, and such divergences often limit rallies. To eliminate the divergence, the OBV must break above its downtrend line. Until that happens, ENA rallies will lack strength.
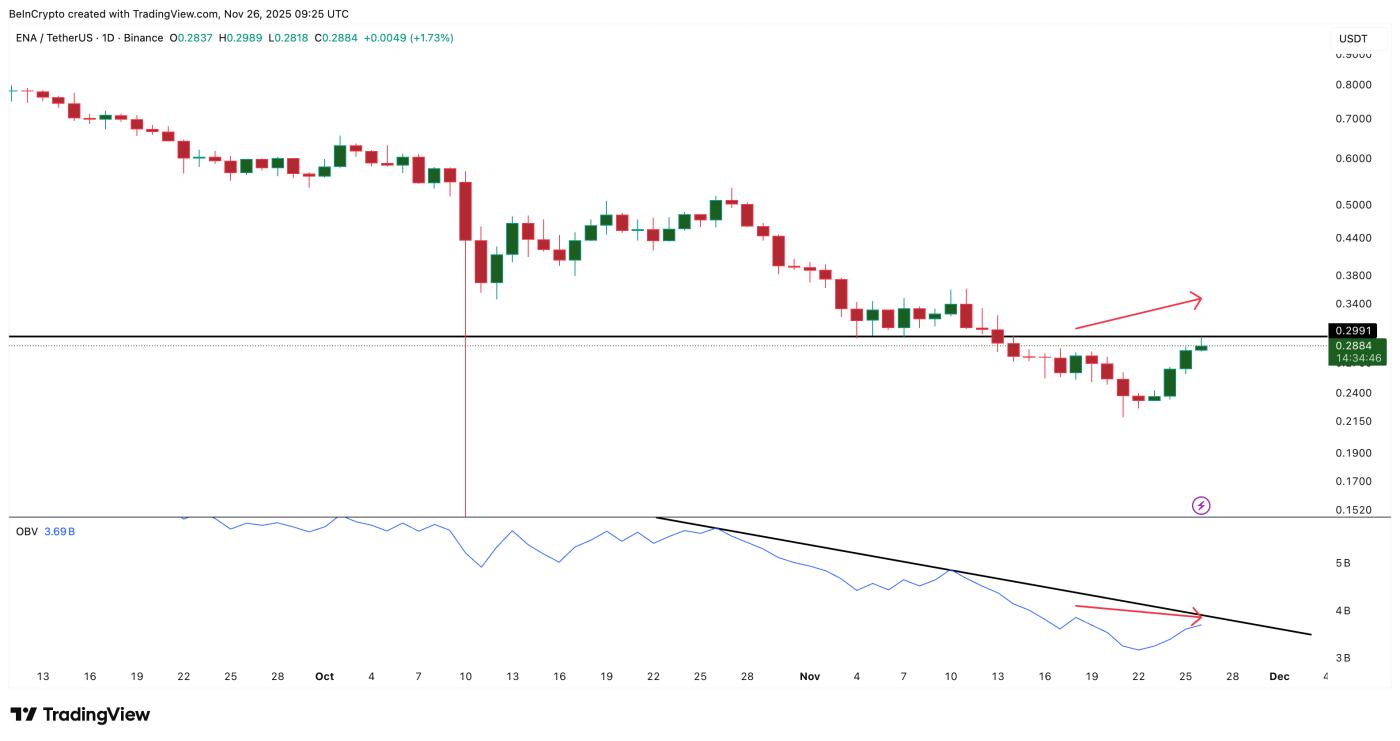 OBV Divergence Doesn't Support Rally: TradingView
Momentum is also not supportive of a breakout.
RSI (Relative Strength Index), an indicator that measures buying power, showed hidden divergence. Between November 10 and November 26, ENA price made a lower high, but RSI made a higher high. Hidden divergence usually appears during an existing downtrend, not before a reversal. This shows that the main trend is still trying to continue down.
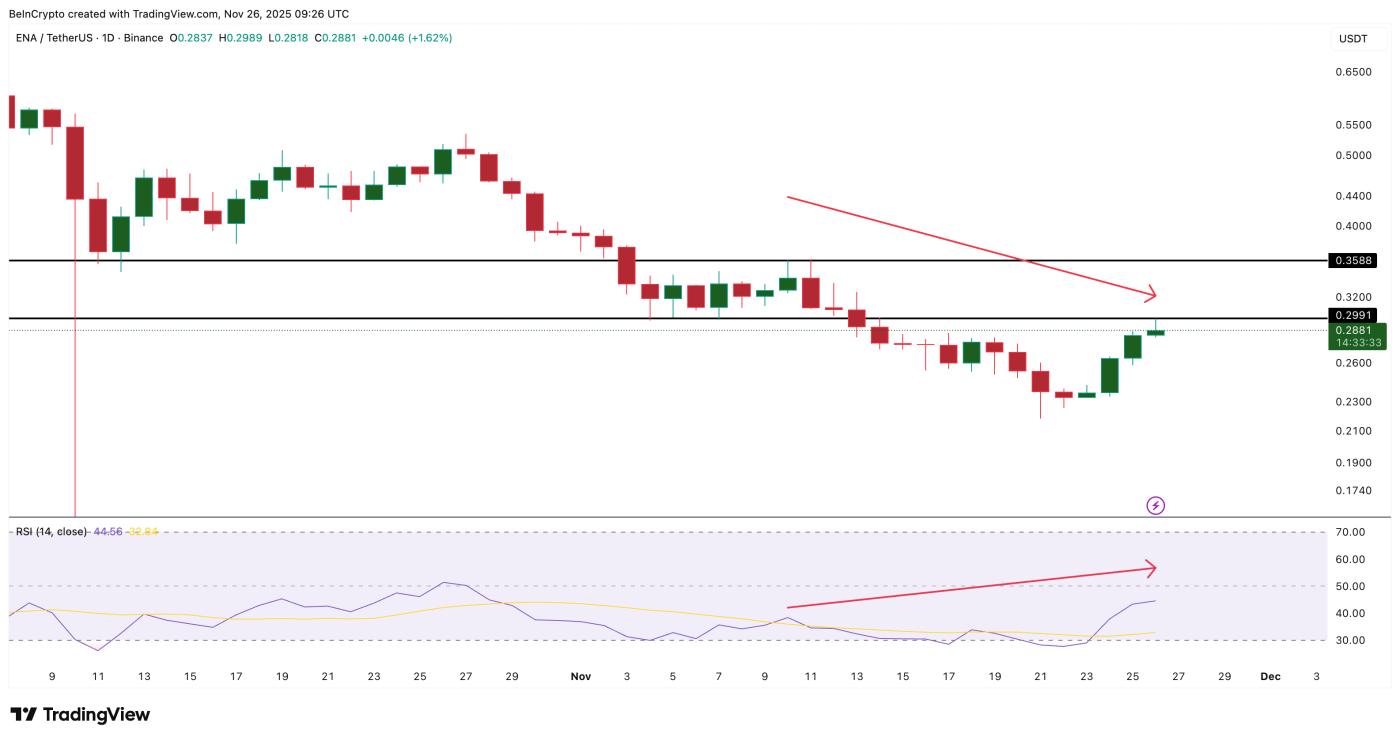 Hidden Bearish Divergence: TradingView
When combining whale selling, a weakening OBV, and a bearish RSI structure, the rally looks more like a temporary recovery than a trend change.
ENA prices show a 13% downside potential
The key short-term level is $0.29. If Ethena (ENA) fails to break above and close above that level, the bounce will lose momentum. This opens the door to $0.24, which is nearly 13% below the current price.
A clear break below $0.24 would open the way towards $0.21, which is a deeper support level if selling pressure increases.
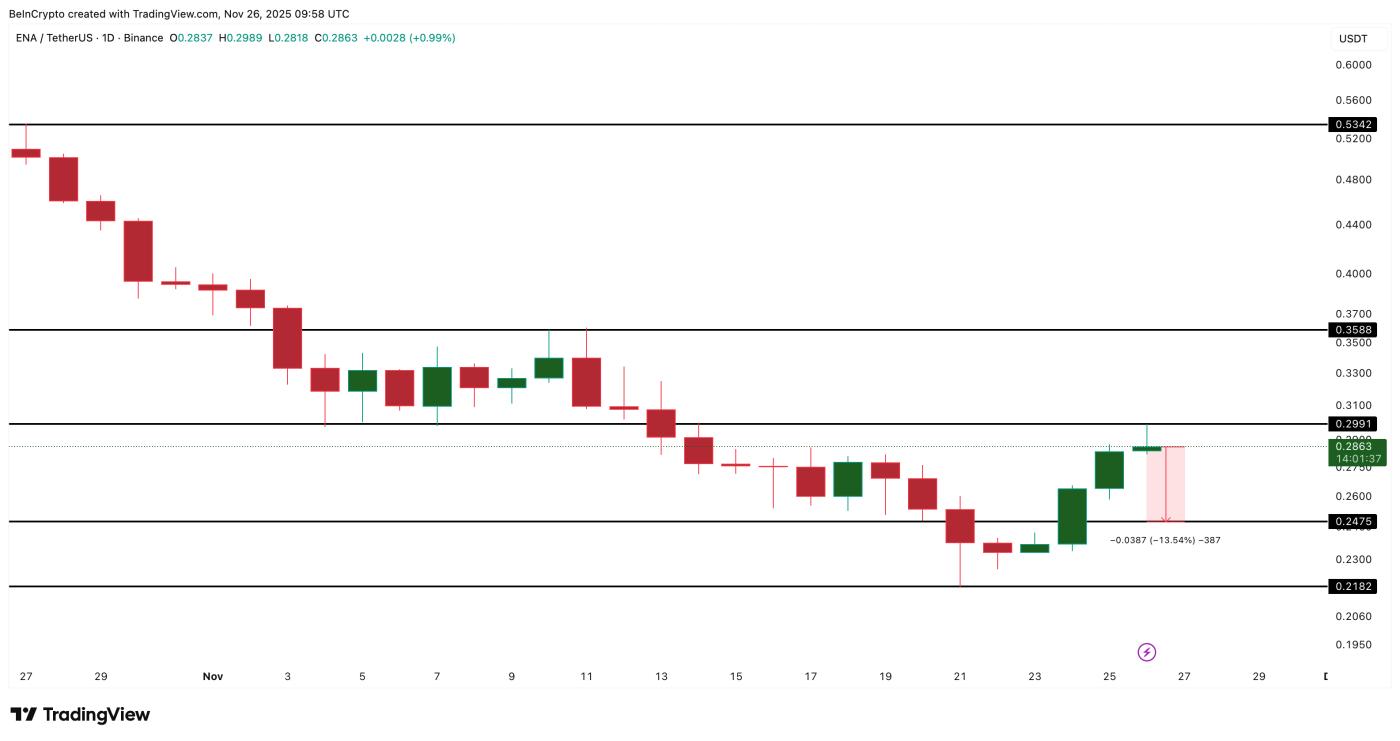 ENA Price Analysis: TradingView
For the rally to gain strength and continue, ENA price needs two steps:
• first, a strong candle close above $0.29, mainly due to OBV breakout (if it happens)
• then broke above $0.35.
Only above $0.35 will the bearish divergences led by the RSI start to weaken, and only then will a move to $0.53 become a reasonable upside target. Until that happens, ENA's bearish bias remains in control.


