

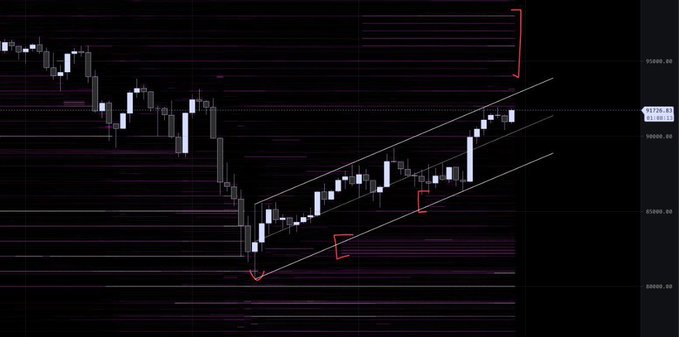
$BTC Here you can see exactly how Binance "drives" the price with the liquidity placed on the heatmap: it's not magic, it's simply observing where they put walls, where they remove them and how the price chases after them. Every time the price fell, they shifted their orders slightly lower, accompanying the decline. And as soon as they'd finished cleaning up, they began removing liquidity below and building it above, forcing the price into this bullish channel. The spikes in volume and the absorption at the lows (the ones you marked in red) confirm that there was real interest in manipulating here. The movement inside the channel was clean, almost textbook: every pullback was met again by fresh liquidity at the lower bands. Now, however, we've reached the key resistance on H4: it's packed with orders, and you can see it straight away from the liquidity block appearing in the top band of the heatmap. It's no longer 'open range' up there: you need real strength to break it, otherwise, it's a classic spot for a fake-out, where they soak up liquidity and then drop back down to clean the bottom of the channel again. In a nutshell: visible manipulation, a clean channel, and now facing the first real wall to break on H4.
Sector:
From Twitter
Disclaimer: The content above is only the author's opinion which does not represent any position of Followin, and is not intended as, and shall not be understood or construed as, investment advice from Followin.
Like
Add to Favorites
Comments
Share
Relevant content


