VRVP Metric
Detailed Explanation of the VRVP Indicator (Visible Volume Distribution Chart)
I. Core Concepts
- Volume Profile: VRVP displays the total trading volume at different price levels in the form of a horizontal bar chart . The longer the bar, the more active the trading activity within that price range .
- Visible Range: Its calculation is based solely on data within the currently displayed time and price range on the chart . This allows traders to focus on analyzing recent market activity.
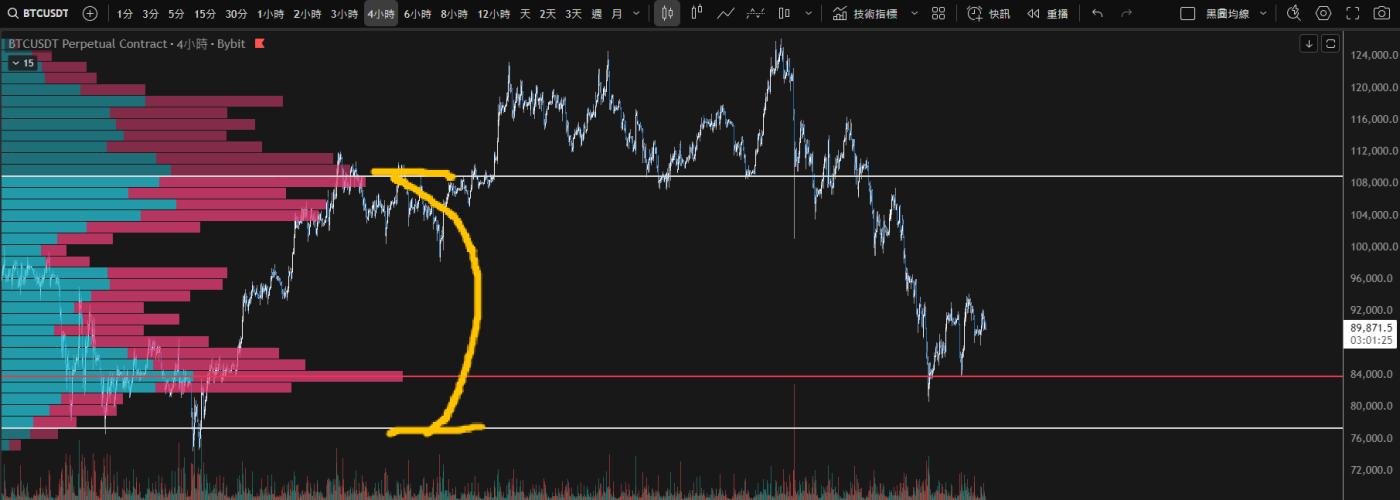
- Key markers:
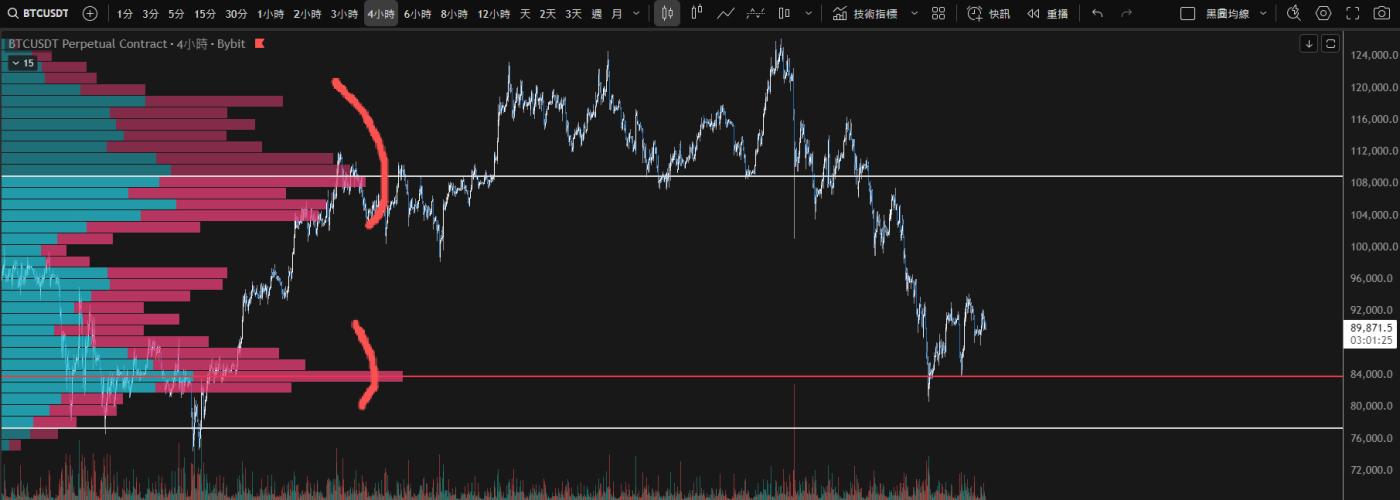
- Red line (POC, Point of Control): This represents the price level with the highest trading volume.
- The two white lines (VAH/VAL) represent the Value Area High and Value Area Low, respectively, and are the upper and lower boundaries of the value area.
II. Main Functions and Uses
VRVP helps traders identify key price zones in the market, and its core function can be summarized as identifying and confirming effective support and resistance levels.
1. Identify support and resistance levels.
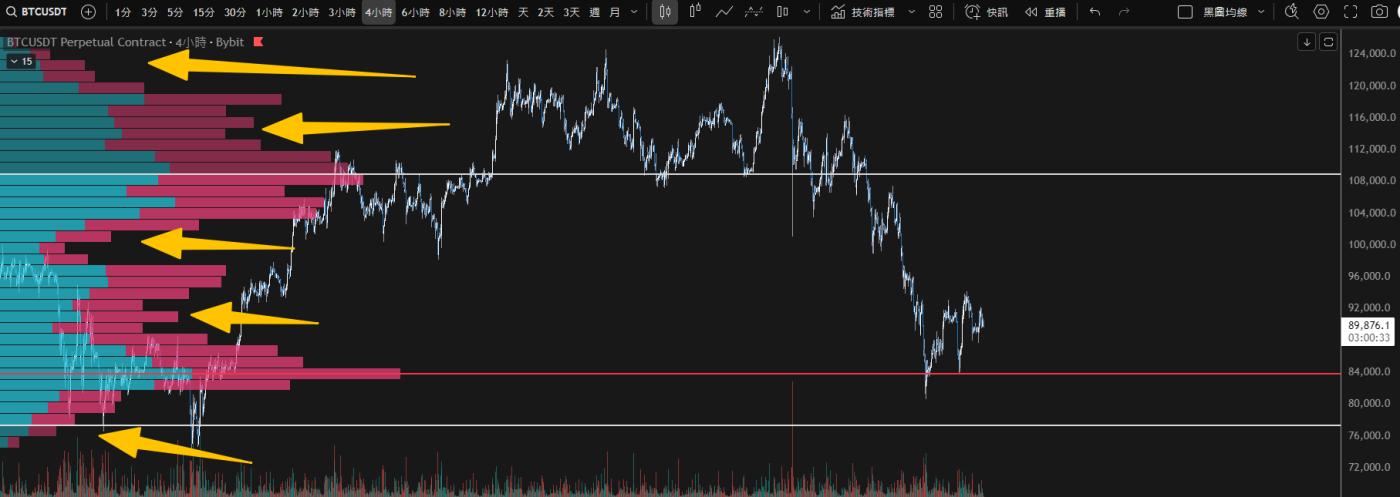
- High Volume Nodes (HVN):
- Price zones with exceptionally high trading volume are considered "fair value zones" where market participants reach a consensus.
- These areas could act as strong support when prices fall in the future; once broken, they could turn into resistance .
- Low Volume Nodes (LVN):
- Areas with sparse trading volume mean that prices stay in that range for a short period of time.
- Prices typically move quickly when they cross these areas in the future.
2. Identify control points and value areas.
- Point of Control (POC):
- The single price level with the highest trading volume across the entire distribution map.
- It is the most recognized "fair price" in the market during that period.

- Value Area (VA):
- Price range that includes a specific percentage (usually 70%) of total trading volume.
- This is the area with the most intensive trading activity in the market.
- The boundary of the value zone (VAH/VAL) is also an important reference point for support and resistance.
- Breakout/Breakdown Strategy (Core Application):
- If the price rises above the POC or HVN, it indicates that the market accepts a higher price and it is likely to continue to rise .
- If the price falls below POC or HVN, it may indicate a change in market consensus, making further downward movement likely .
- Pullback trading: When the price falls back to near the POC or HVN, consider it an optimal entry point for buying or selling .
- Range trading: Trading within a value zone (VA) with stop-loss orders placed outside the boundaries of the value zone (VAH or VAL).
III. Summary of Trading Applications
VRVP is easy to understand; it acts as both support and resistance.VRVP is typically used to develop strategies.
The next article will use moving averages for instruction!