

The December 9–10 FOMC meeting is drawing intense attention as traders are pricing in the possibility of a 25 basis point rate cut, a move that could bring a brief burst of liquidation back to risk assets. Crypto markets are still moving cautiously, down about 1.1% ahead of the announcement. However, some crypto whales are taking early positions.
Several Token are seeing a clear increase in accumulation from whales, with a few of them showing bounce or breakout patterns on their charts. This article lists three such Token .
Aster (ASTER)
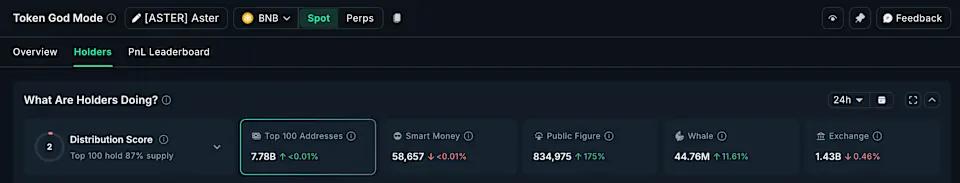
Aster is showing one of the strongest accumulation signals from crypto whales in the past 24 hours. The Token is down 4% today and over 10% over the past month, but whales have added 11.61% to their holdings, bringing the total to 44.76 million ASTER at a price of around $0.93. This means Aster whales have added around 4.67 million Token, worth nearly $4.34 million at current prices.
Accumulation on weakness is often a sign that whales expect conditions to change after the FOMC meeting results are released.
The ASTER price chart provides part of the explanation.
From November 3 to December 7, Aster's price made a higher Dip , while the RSI — a momentum indicator — made a lower Dip . This created a “hidden bullish divergence,” a structure that often signals a trend continuation and waning selling pressure.
A similar pattern emerged from November 3 to November 29, with Aster rising about 22% thereafter. Crypto whales may be betting early on a similar reaction if market sentiment turns “risk-on” after the rate decision.
ASTER price is also moving within a tightening triangle pattern, which usually reflects indecision between buyers and sellers before a larger breakout. The first level to reclaim is $1.01. A break of this zone could see the price head towards $1.08, and a stronger move could push the Token towards the $1.40 zone.
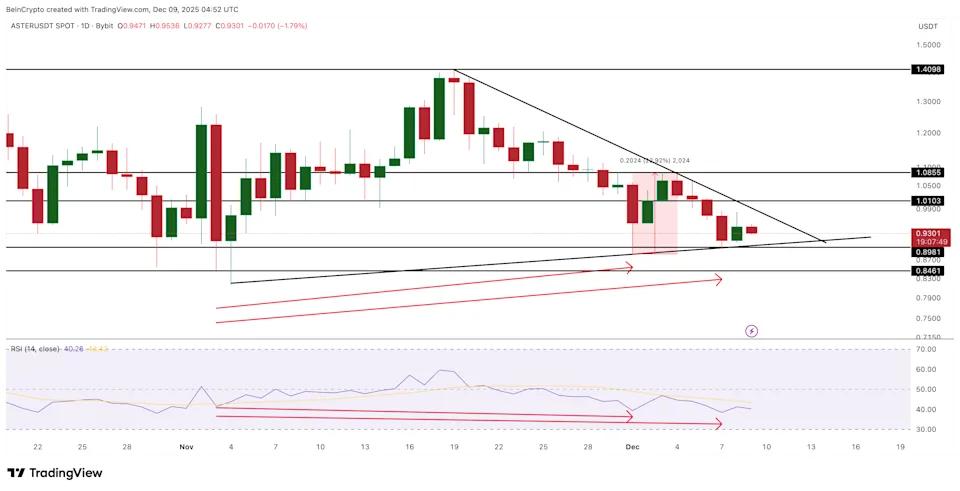
But the structure would fail if Aster breaks below $0.89, which could open the way to $0.84 and invalidate the trend continuation pattern that whales are tracking.
Pippin (PIPPIN)
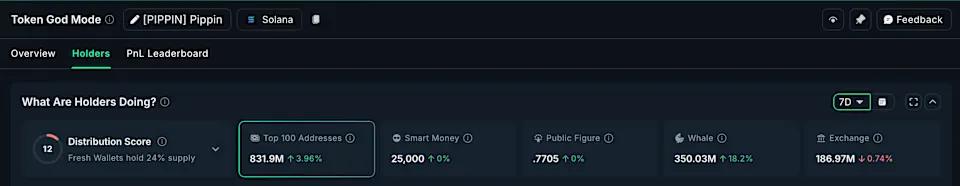
Pippin is the second Token to see significant accumulation from crypto whales ahead of the December FOMC meeting. Whales have expanded their holdings by 18.2% over the past seven days, bringing their total to 350.03 million PIPPIN. This means they have added approximately 53.9 million PIPPIN, worth approximately $9.75 million at current prices.
The top 100 addresses (mega whales) also increased their positions, adding 3.96% to their holdings. When whales and large holder accumulate during sideways price movements, it is often a sign that they expect a new round of volatility to develop.
PIPPIN's price action reinforces that view.
Pippin is up 3.06% in the past 24 hours after a quiet week, but is still up over 400% over the past month. The current structure resembles a “Bull flag,” a continuation pattern that occurs when a strong rally stalls. Whales entering positions during the accumulation phase suggests they expect increased volatility after the FOMC decision.
PIPPIN needs to reclaim $0.21 and $0.26 to confirm a breakout from the bull flag pattern. A strong breakout would require clearing $0.34, which has Vai as strong resistance since Pippin topped out. Currently, PIPPIN has broken the upper trendline of the flag, but needs a daily candle close above $0.21 to confirm.
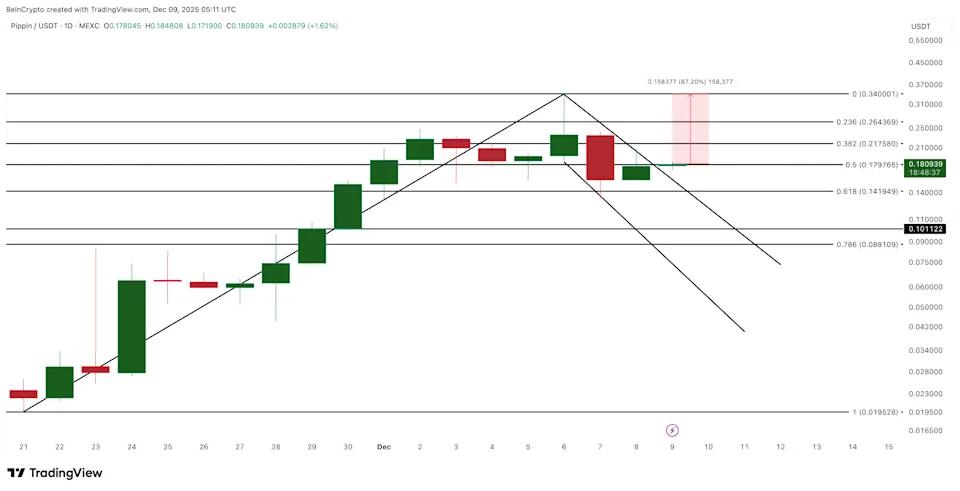
If PIPPIN falls below $0.14, the structure will weaken, and a drop below $0.10 could completely destroy the pattern, sending the price to deeper support around $0.08. For now, however, whales seem to be XEM this accumulation phase as an opportunity, not exhaustion.
Chainlink (LINK)
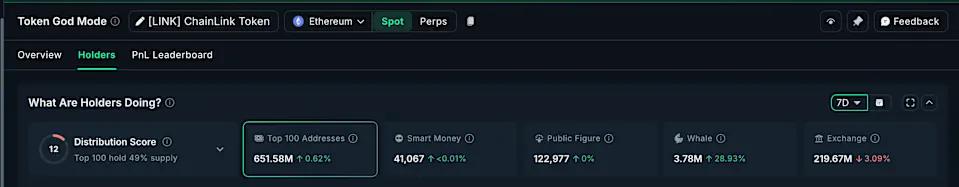
Chainlink is the third Token that has seen steady interest from crypto whales ahead of the December FOMC meeting and rate cut expectations. Over the past seven days, LINK whales have increased their holdings by 28.93%, bringing their total to 3.78 million LINK. At current prices, this additional purchase is worth approximately $11.5 million.
The top 100 addresses also increased their holdings by 0.62%, while the amount of LINK on the exchange decreased by 3.09%. These data generally suggest increased demand from both whales and retail investors.
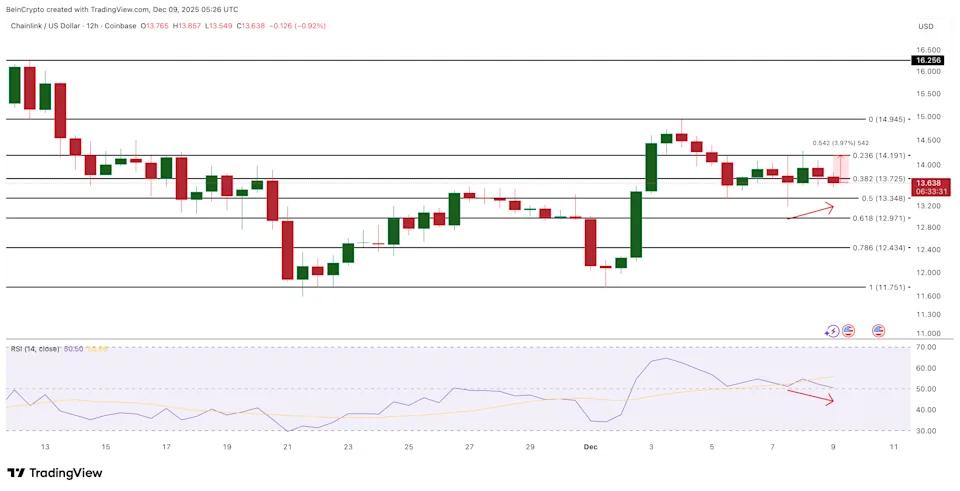
The whales’ belief is consistent with what the 12-hour chart shows. LINK is up 12.5% this week, indicating a short-term uptrend. From December 7 to 9, the price made a higher Dip , but the RSI made a lower Dip — a hidden bullish divergence. Hidden bullish divergences often signal a trend continuation, as they show that selling pressure is waning even as the price remains higher.
For this pattern to play out, LINK needs to break clear above $13.72 with a solid 12-hour candle close. A more important hurdle lies at $14.19, the level that rejected LINK earlier in the week. A break above this area could see LINK move towards $14.95, and above that, the next major resistance is around $16.25.
If the market turns “risk-off” after the FOMC meeting, the first support zone to watch is $12.97 — the 0.618 Fibonacci level. Losing this zone could push the price to $11.75, a strong support level since December 1.
Whales are actively adding while LINK is showing hidden bullish divergence, creating a structure where even a small bump in market liquidation from the FOMC outcome could extend the current uptrend.


