

Bitcoin, gold, and silver prices continued their upward trend this week, as the leading cryptocurrency and these two safe-haven commodities watched the Fed's interest rate decision from behind the scenes.
Following policymakers' decision to further reduce interest rates by 0.25%, data shows that the US stock market is no longer experiencing the same level of anxiety as before. This is a significant shift, the last seen since early October.
Bitcoin, gold, silver: updated price forecasts as the stock market stabilizes.
The US stock market reached an All-Time-High on Thursday, December 11, 2024. Experts predict the upward trend will continue. This development followed the Fed's interest rate cut , a move that typically helps boost stock markets.
Lower borrowing costs contribute to increased business profits, while also encouraging business investment and increasing the value of future earnings. When interest rates are low, consumer borrowing becomes easier, while many investors will shift from bonds to stocks in search of higher returns.
Overall, this helps increase liquidation and risk appetite, which often leads to stock prices rising across many sectors. That's why the current stock market no longer shows the fear it once did.
Meanwhile, Bitcoin, gold, and silver are also expected to perform similarly, with XAU and XAG prices surging due to lower holding costs and rising inflation expectations.
Signs of a bullish reversal in Bitcoin's price as liquidation flows back in.
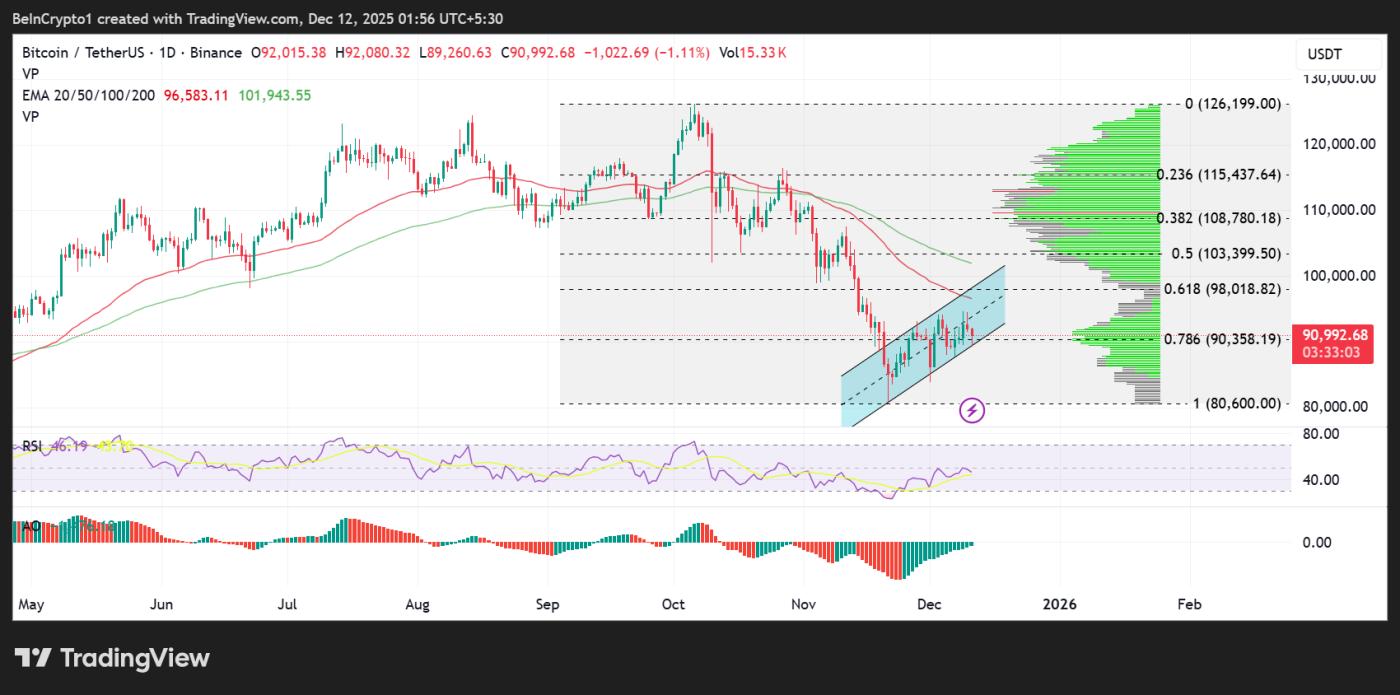
The daily chart for Bitcoin shows the price recovering inside a clear ascending price channel , formed after a sharp correction from the peak in early October.
Although the price is currently still below the key exponential moving Medium (50 and 100 at $96,583 and $101,943 respectively), BTC has shown initial signs of trend stabilization. Each recent Dip has been higher than the previous Dip – a typical sign of an early recovery phase.
The strong buying volume band (green horizontal bar) indicates a significant trading concentration around the 78.6% Fibonacci level at $90,358, suggesting that buyers may defend this crucial support zone.
This level could become a turning point for price reversal, as well as a springboard for further BTC price increases.
If the closing price candle holds above $90,358, BTC could conquer the strong liquidation resistance zone between $98,000 and $103,000.
Currently, the Relative Strength Index (RSI) indicator remains neutral, suggesting that the price still has room to fluctuate in both directions.
The histogram of the Awesome Oscillator (AO) indicator is slanted toward the positive side and turning green, reflecting a strengthening upward momentum.
 Bitcoin (BTC) price performance. Source: TradingView
However, the short-term uptrend will only be maintained if BTC remains within the current ascending price channel. If it breaks below the lower level of the channel, coinciding with the 78.6% Fibonacci level at $90,358, the price will face downward pressure, potentially falling to the support zone of $86,000 to $80,600.
The biggest challenge for BTC right now remains to return to and hold the two important EMAs (50-day and 100-day exponential moving Medium ) around $96,583 and $101,943 respectively.
History shows that when BTC breaks above these Medium during mid-cycle consolidation phases, the trend can accelerate sharply.
In summary, BTC is recovering cautiously, with increasing volume and a positive price channel pattern – but only a breakout above the psychological $100,000 level will truly confirm the uptrend.
The upward momentum in gold prices intensified after breaking through a key resistance level.
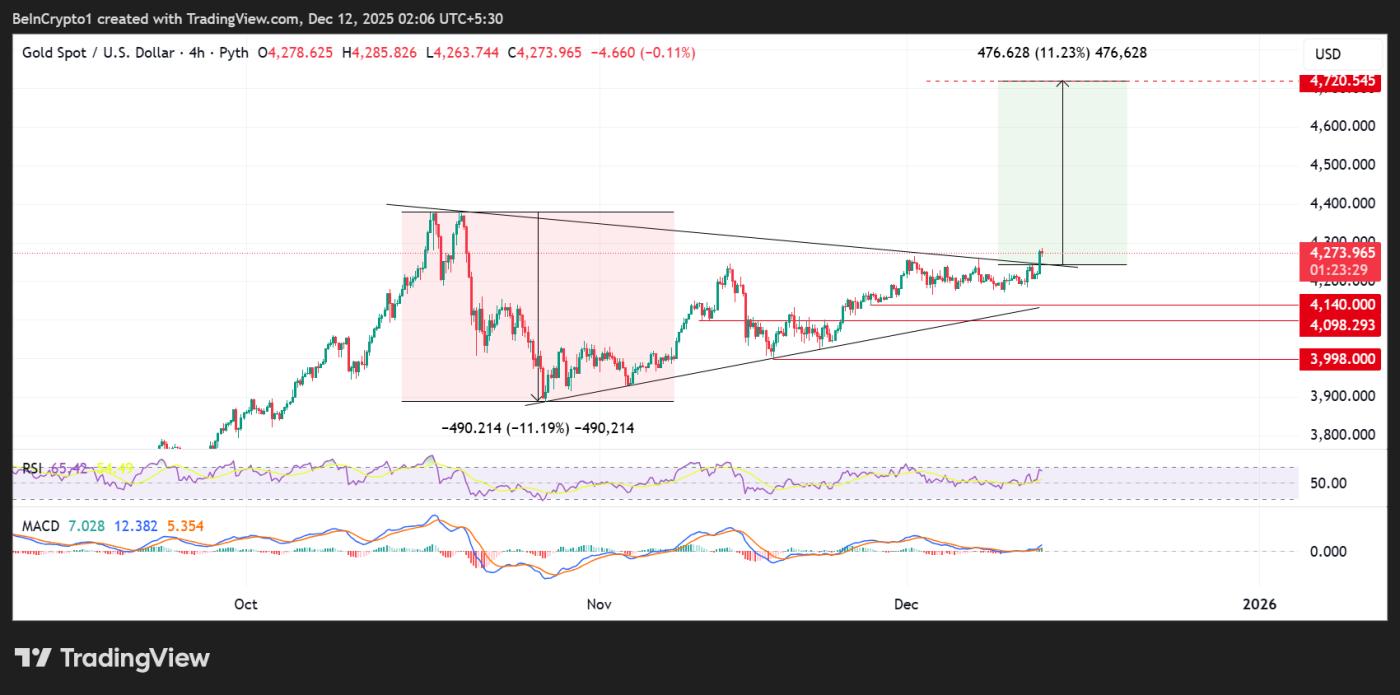
On the 4-hour timeframe of the XAU/USD trading pair, gold prices are showing clear signs of breaking out of a prolonged, tightly compressed symmetrical triangle pattern. This technical pattern emerged after a sharp correction of $490 (-11.19%) in the recent quarter.
An isosceles triangle following an uptrend is often a consolidation pattern, before the price continues in the old trend. The breakout in gold fits this theory, as the price broke through the downtrend line with strong momentum.
The triangle height measurement scenario targets a gold price increase to around $4,720 – a rise of over 11% from the breakout point.
Currently, gold prices are fluctuating steadily around $4,273, where the breakout candlestick ended. As long as gold holds above the upper boundary of the triangle, the bullish pattern remains intact.
Traders looking to open buy orders for XAU/USD may consider waiting for gold to successfully retest the upper trendline.
The RSI is currently in the middle range but leaning towards the positive at 65, indicating that gold is not yet overbought. The upward trend of the RSI reflects upward momentum, which is a good pattern for further price increases.
The MACD line is crossing upwards and gradually widening the gap, signaling increasing buying pressure.
Key support levels to watch are $4,180, $4,140, $4,098, and a deeper pivot point at $3,998 – the Dip of the previous corrective wave. As long as gold prices remain above these levels, the uptrend remains.
 Gold price movements (XAU). Source: TradingView
Notably, gold's breakout from its strong consolidation zone coincides with a broader macroeconomic picture: escalating geopolitical tensions, persistent inflation concerns , and strong gold demand from central banks .
Technically, the current price structure supports the possibility that gold will retest, or even surpass , its recent high .
The long-term cup and handle pattern in Silver prices indicates strong upside potential.
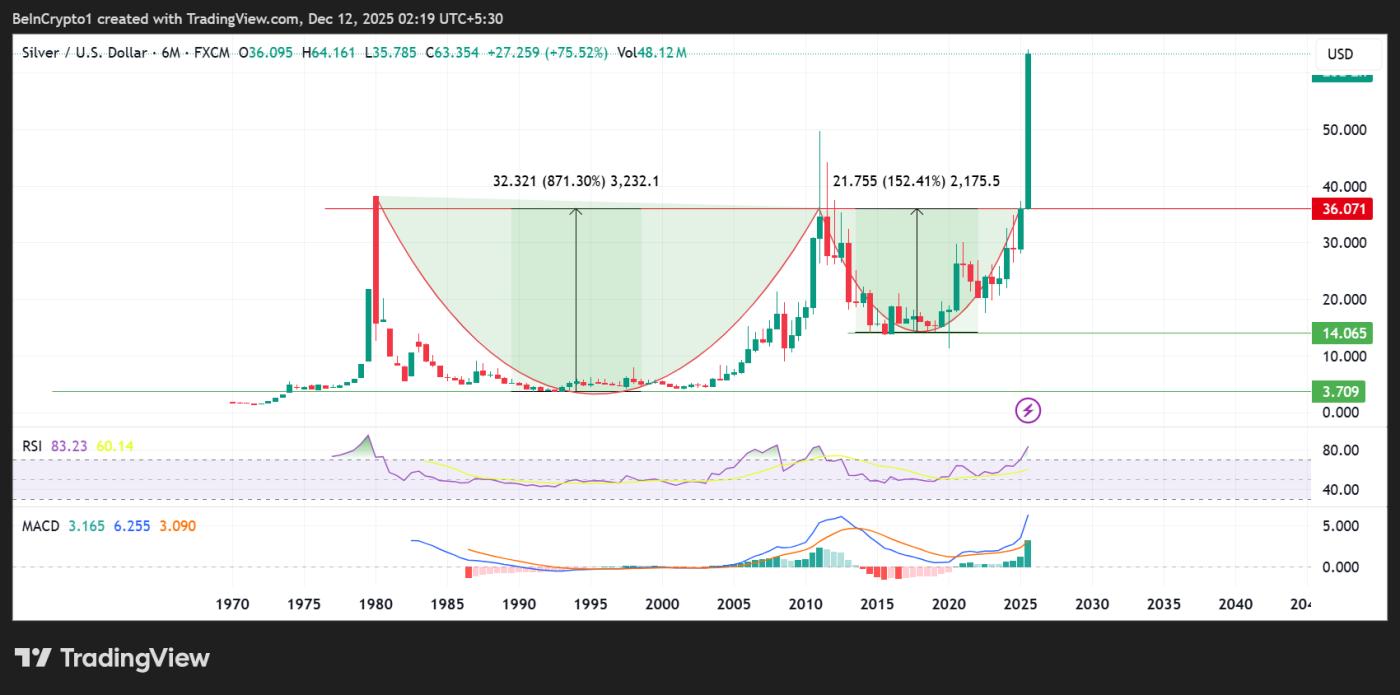
The price chart of silver over the past several decades is showing one of the strongest long-term bullish patterns in commodity markets : a very large Cup & Handle pattern that has lasted for many cycles.
The “cup” portion extends from the 1980 peak to the 2011 correction phase, representing an estimated increase of 871%. The smaller but equally significant “handle,” formed between 2011 and 2024, shows an increase of approximately 152%. Both patterns converge at resistance around $36, a level that silver has struggled to overcome for over 40 years.
The most recent candlestick shows that silver has broken through this resistance zone with high volume , signaling a strong structural shift rather than just a short-term spike.
When a commodity breaks through a price ceiling that has lasted for decades, the price can rise very quickly because there is no longer historical resistance to stop it.
 Silver (XAG) price movement. Source: TradingView
However, the RSI is currently in the overbought zone (above 80), but for long-term breakouts, this is often a sign of very strong buying momentum, not necessarily an end to the uptrend. The MACD indicator also confirms the strong uptrend for silver.
If this breakout momentum is sustained, the next psychological resistance level for silver will be $70, with the historical peak of 1980/2011 around $50 now turning into a support zone.
With a prolonged accumulation period and a tight silver supply for many years, the possibility of silver breaking its historical high in the near future is entirely plausible.
However, Capital prices are known for their volatility, so a return to test the $36 level before continuing to rise is perfectly normal.


