

Bitcoin heads into Christmas 2025 in a somewhat fragile but also intriguing state. The price is currently trading around $93,000 after weeks of pressure. Four key charts suggest the market is in the final stages of a correction cycle, but there are still no clear signals indicating a strong upward trend.
Data reveals three major factors dominating the market. Recent buyers are suffering heavy losses, while new "whales" are also selling off. Macroeconomic conditions remain the primary price determinant, although buying pressure in the spot market is quietly returning.
Small retail investors holding Bitcoin for the short term are suffering heavy losses.
The first chart tracks the actual profit/loss data of the short-term (STH) holder group . This group consists of coins purchased in the last few months. Their "actual price" is the Medium price at which they bought these coins.
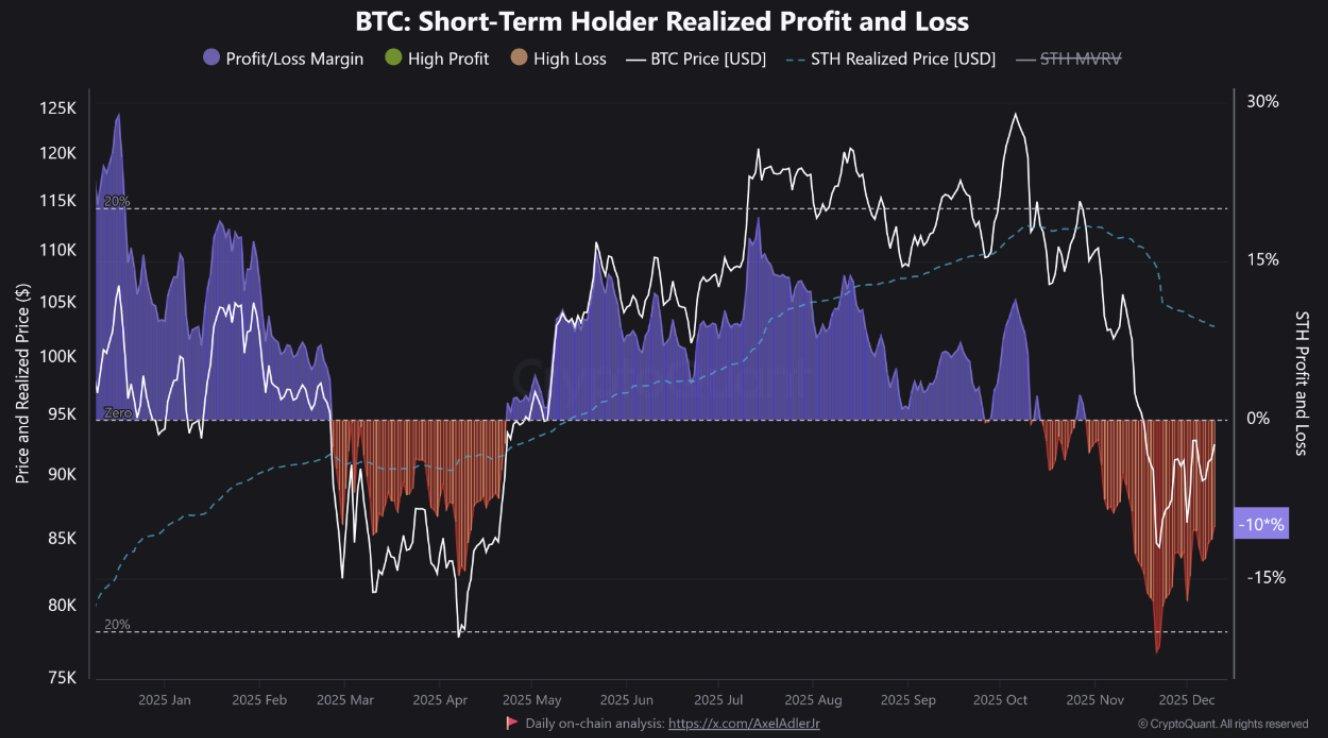 Actual profit/loss for short-term Bitcoin holder . Source: CryptoQuant
In early 2025, STHs (Straight Through Trading) were quite profitable. At that time, their Medium position yielded a profit of 15–20% as Bitcoin prices surged. This period encouraged many to take profits and created selling pressure around the peak price.
But now, the situation is reversed. Bitcoin is currently trading below the intrinsic value of the STH group , and this group is losing approximately -10%. On the chart, the histogram bar has turned deep red, indicating this is one of the deepest loss periods of 2025.
This has two consequences.
In the short term, losing holder often take advantage of price rallies to sell. Many only want to sell at break- Capital price, which hinders rallies when prices reach their entry points.
However, such deep and prolonged loss zones usually only appear at the end of major corrections. This suggests that those who were "weak-handed" have suffered significant losses and have most likely sold off their holdings.
At some point, the selling pressure from this group will gradually dry up.
Historically, a significant reversal signal often appears when the price breaks back above the STH's actual price from below. When this happens, it means most of the forced selling pressure has subsided, and new buyers have absorbed all of that supply.
Until this signal emerges, the chart still suggests the market should remain cautious and will likely continue to trade sideways around the current price level.
The Bitcoin whale has just "surrendered".
The second chart shows the actual profit/loss by whale group. The data separates the cash flow between “new whales” and “old whales”. New whales are those who have recently bought large quantities of Bitcoin.
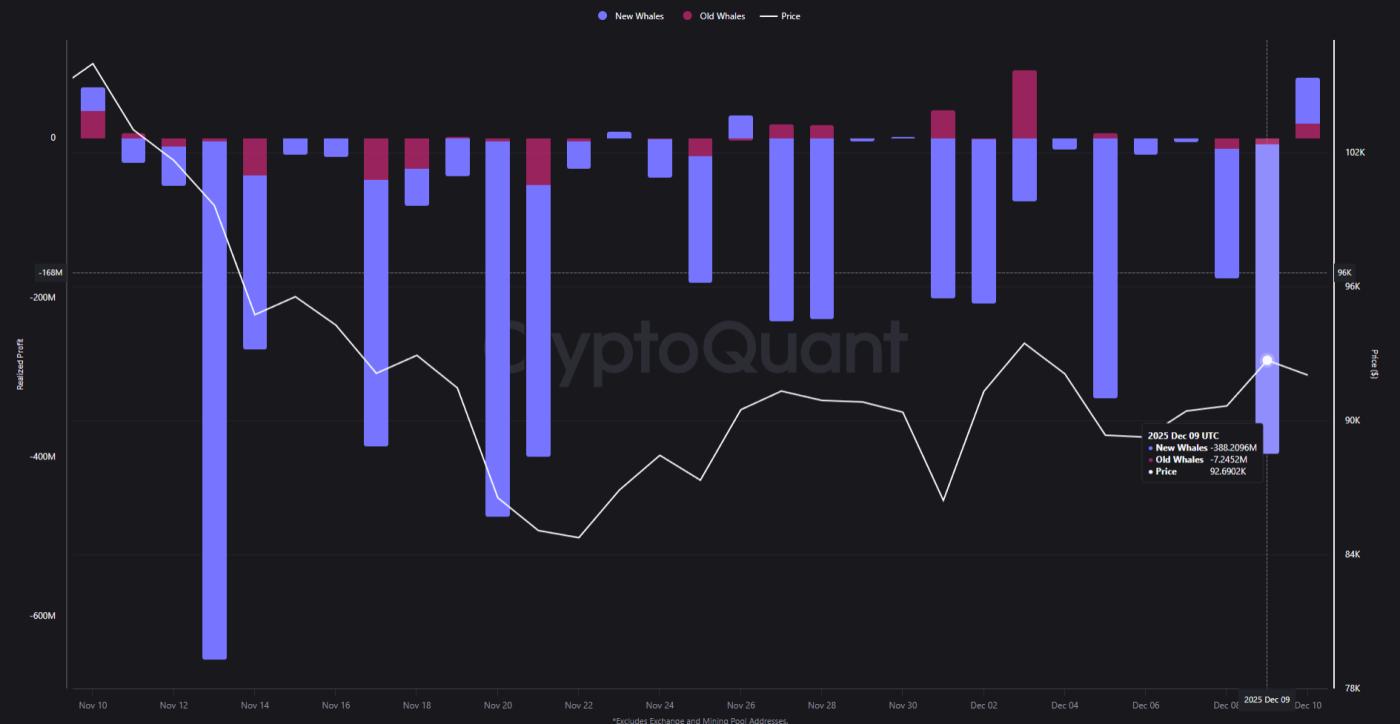 Actual profits of Bitcoin whales as of November 2025. Source: CryptoQuant
Yesterday, new whales closed out $386 million in losses in just one day. Their data column on the chart showed a massive drop. In addition, several other large loss columns appeared around the recent Dip .
Old whales are different. Their profits and losses are smaller and more balanced. They don't sell aggressively and flee like the new whales.
This trend often emerges at the end of correction phases . New whales typically buy in at high prices, sometimes using leverage or being swept up in bullish narratives. When the market moves against expectations, they are the first to sell off.
This sell-off is actually beneficial for the market in the long term. Coins will shift from the hands of large, emotionally vulnerable investors to stronger holder or smaller retail investors. After these sell-offs, the selling pressure from this group also decreases significantly.
In the short term, such sharp selling could still cause prices to fall further. But in the medium term, this will improve the quality of current Bitcoin holder .
The market will stabilize and become more resilient after the panicked large investors have sold off all their holdings.
Real interest rates still affect Bitcoin.
The third chart combines Bitcoin and the real yield of a 2-year US Treasury bond (in the opposite direction). The real yield is the interest rate after accounting for inflation. These two indicators are expected to move in almost the same direction in 2025.
When real yields fall, the chart reversal line rises. Bitcoin will often rise at the same time due to improved liquidation . Falling real yields also make risky assets like Bitcoin more attractive compared to safe-haven bonds.
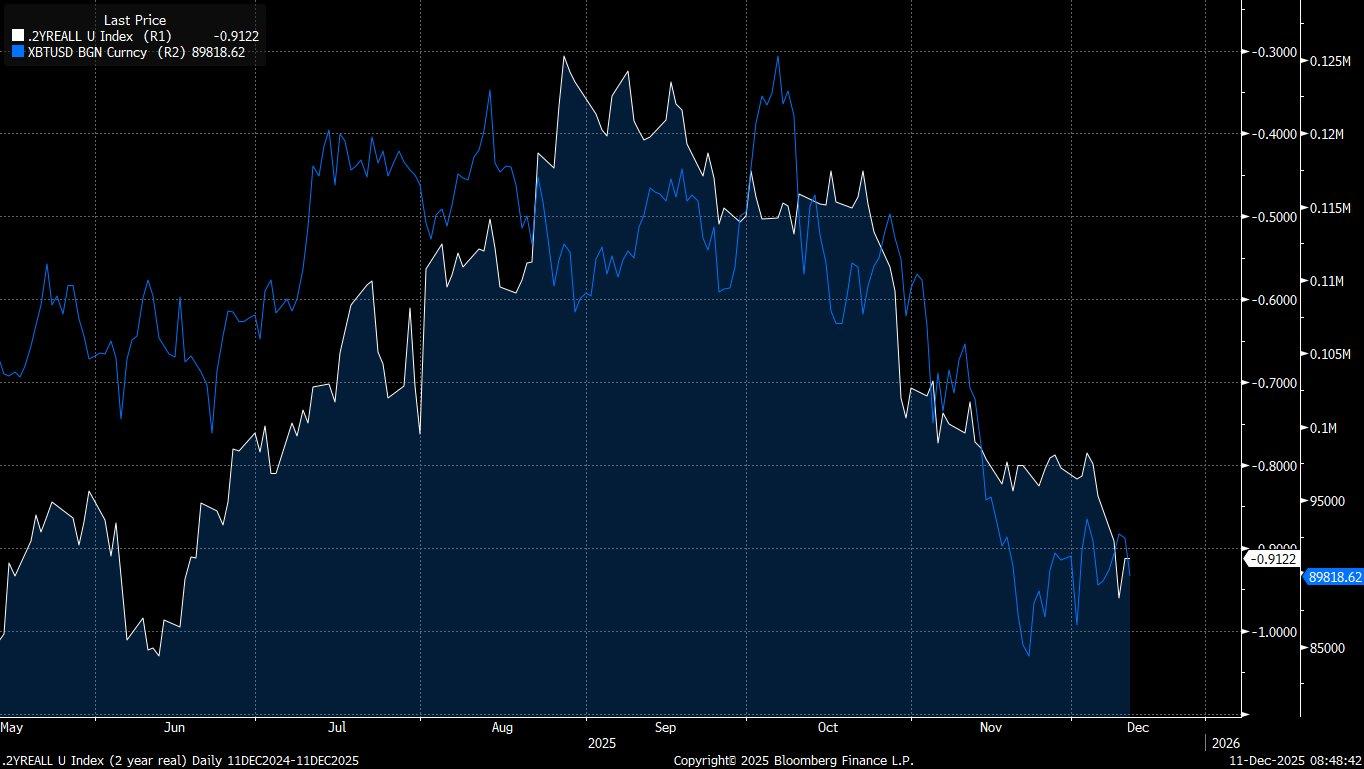 Comparing the real yield curve of a 2-year bond (inverted) and Bitcoin.
Since the end of summer, real yields have been rising again. The chart reversal line has started to trend downwards, and Bitcoin has also fallen. This indicates that macroeconomic factors remain the main driver of price trends.
The Federal Reserve's interest rate cuts may not be enough to change the situation. What's crucial is how the market assesses the real cost of borrowing in the future. If inflation expectations fall faster than nominal interest rates, real yields could rise further.
With Bitcoin, a sustainable price surge can only occur if real-world conditions become more favorable. As long as the bond market hasn't reflected this change, Bitcoin's rallies will continue to face resistance from macroeconomic factors.
Spot taker buyers are returning.
The fourth chart tracks the 90-day CVD Taker Spot on major exchanges. The CVD indicator measures the net volume of market orders traded through the buy-sell price levels.
This indicator shows whether aggressive buyers or sellers are dominating the market.
For several weeks during the price decline, the trend was dominated by takers. Red bars filled the chart as sellers continuously placed aggressive sell orders in the spot market. This is consistent with a prolonged, slow downward price trend.
But the signal has now reversed. The index has just shifted to the buy side, with takers dominating, and green bars are starting to reappear. This means that strong buyers are now outnumbering strong sellers on the spot markets.
This is an early but very noteworthy change. Trend reversals often begin with small changes in trading behavior like this. First, buyers come in, then the price stabilizes, and only then do larger amounts of money enter the market.
One day of data alone isn't enough. However, if the trend of green bars persists, it confirms that demand has truly returned. This indicates that the spot market is absorbing the supply from short-term investors and large whales selling off.
What does this mean for the price of Bitcoin as Christmas approaches?
XEM at all four charts simultaneously, it's clear this is the final stage of a correction, not yet a new bull market.
Retail investors and emerging whales are suffering heavy losses, and they still tend to sell when prices rebound slightly. Meanwhile, high real interest rates continue to limit risk appetite in the overall market.
However, some factors suggesting a potential recovery are also beginning to emerge. The recent sell-off by whales is making the investor structure healthier.
Buyers on the spot market are returning to take over, helping to slow the rate of price decline.
As we approach Christmas 2025 , Bitcoin is still trading within a range with a slight downward trend, around $90,000.
A sharp drop to the high or Medium range of $80,000 is still possible if real interest rates remain high. For a clear upward market reversal, three signals must converge:
First, prices must rise above and hold at the Capital basis for short-term retail investors. Second, the real two-year interest rate needs to fall, making financial conditions more manageable.
Third, the dominance of the Taker side must be maintained, demonstrating genuinely strong buying power in the spot market.
Until these three factors converge, the market will remain volatile, driven by macroeconomic data and the sentiment of those holding unsold positions. For long-term investors, this period is more suitable for planning than for making aggressive bets.


