Pi Coin has been struggling since the end of November. After peaking at the end of the month, the price has dropped by approximately 28%, erasing almost all of its previous gains. In just the last seven days, Pi Coin has fallen by about 8.6%, and in the last three months, the cumulative decline has exceeded 40%.
Despite weak prices, the latest chart data reveals new signals emerging within the market. Momentum pressure is beginning to shift, raising the question of whether the correction might be about to pause. Will this pause lead to a recovery or a complete reversal? Let's find out!
Momentum pressure is easing, but buyers remain hesitant.
On the daily chart, Pi Coin showed a hidden bullish divergence from November 4, 2023 to December 11, 2023. During this period, the price formed higher Dip , while the Relative Strength Index (RSI) formed lower Dip . RSI is a momentum indicator – showing the rate of buying or selling. When the price remains higher but momentum weakens, it usually indicates that selling pressure is gradually decreasing.
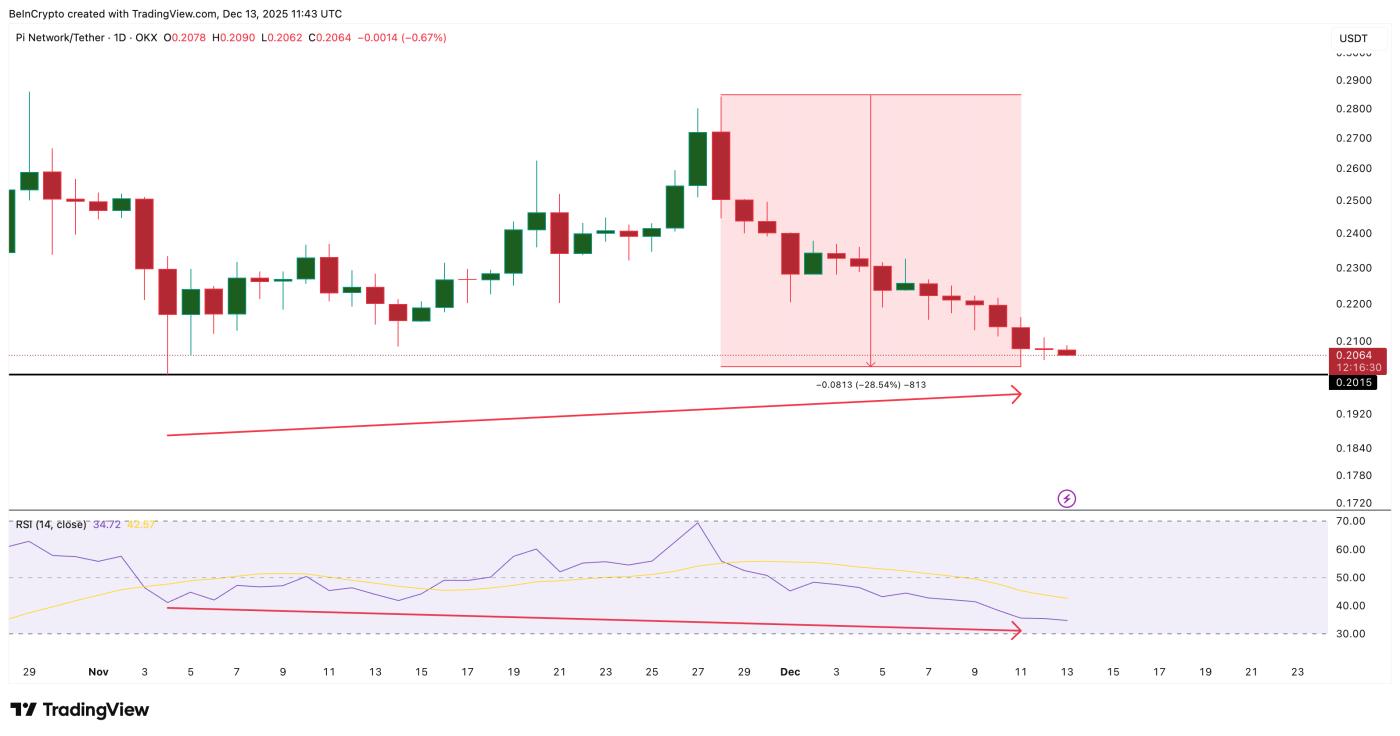 Bullish signals on the Pi chart: TradingView
Want more insights on Token? Sign up for editor Harsh Notariya's daily Crypto newsletter here .
This type of divergence often appears when the market is about to end a sharp decline. It doesn't confirm a complete reversal, but it usually signals that the price may rebound slightly as the sellers weaken.
However, such a change in momentum is still insufficient. The Chaikin Money Flow indicator – which shows large amounts of money flowing into or out of the market – is still signaling caution. The CMF remains close to the descending trend line (connecting lower Dip ) and is still below zero. This suggests that large amounts of money have not yet truly returned to support Pi Coin.
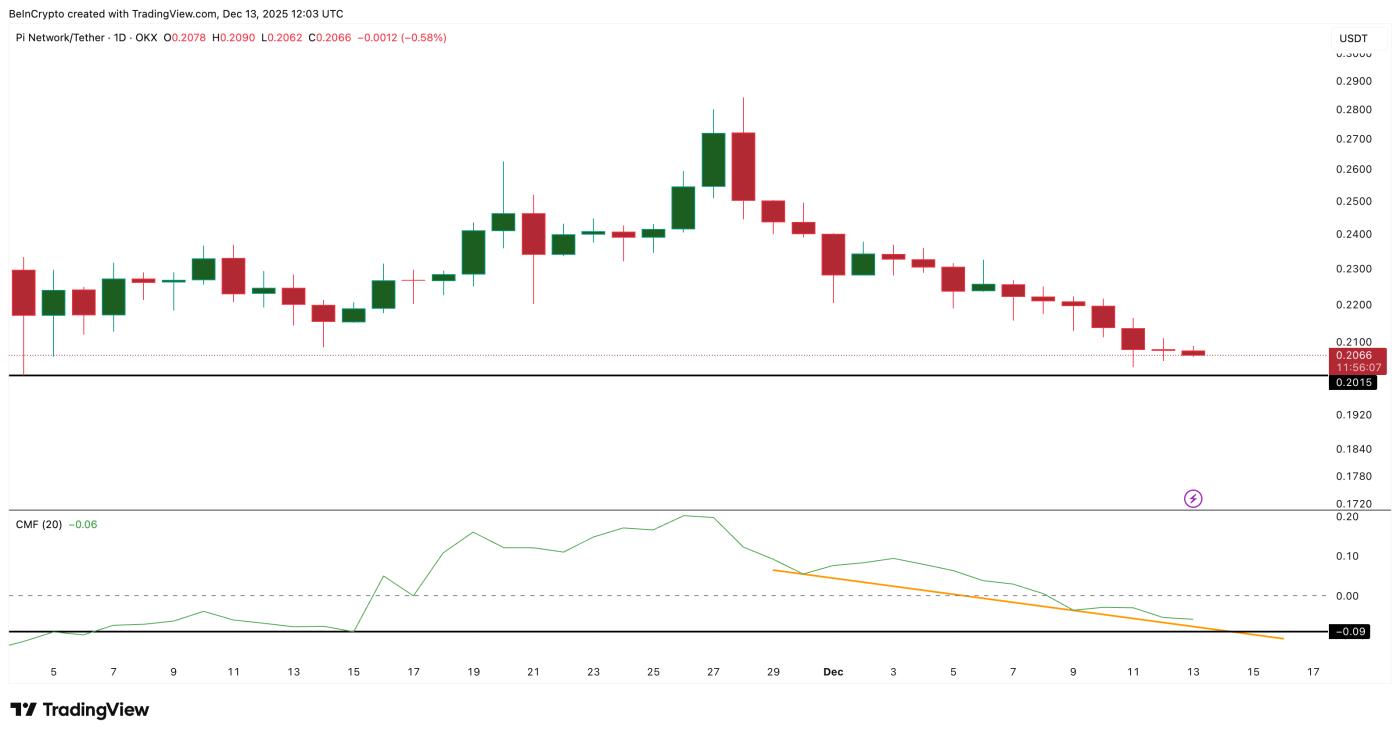 Large capital flows remain weak: TradingView
Simply put, selling pressure seems to be easing, but large investors haven't really gotten involved yet. This makes the recovery pattern quite fragile. If cash flow doesn't improve, attempts at price increases will be easily hampered. Conversely, if the CMF falls significantly below the trend line, the potential for a recovery (rather than a reversal) of the Pi Network Token could be completely invalidated.
Pi Coin prices will determine the next trend.
On the chart, the PI Token price is currently at a critical juncture. For a strong recovery to materialize, Pi Coin needs to break above the $0.222 level. If the price remains above this level, equivalent to a gain of approximately 7%, it would signal that buyers are beginning to defend higher prices. If so, the price could continue to advance towards the $0.244 and even $0.253 regions, provided the overall market remains stable and sideways.
Only when the price surpasses the $0.284 mark (the peak at the end of November 2023) can it be XEM a clear sign of a reversal. However, at this point, that possibility is still far off.
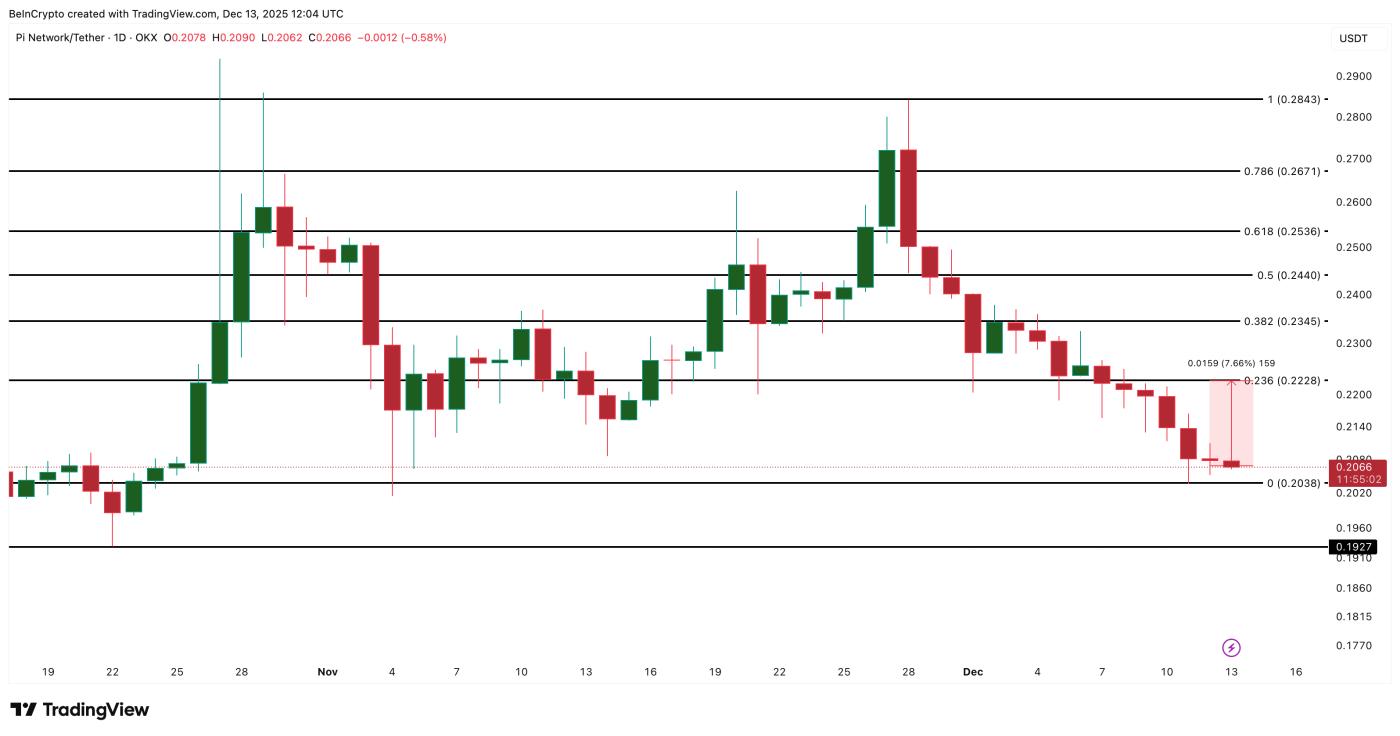 Pi Coin Price Analysis: TradingView
The current support zone is located just below the current price. The $0.203 level is crucial. If the closing price falls below $0.203, expectations of a recovery will weaken significantly, and the risk of a sharp decline will return. If this zone is breached, Pi Coin could continue its downward plunge, prolonging the correction.
A recovery scenario only becomes truly clear when prices rise accompanied by the CMF approaching zero. Without confirmation from cash flow, rallies are likely to stall quickly.