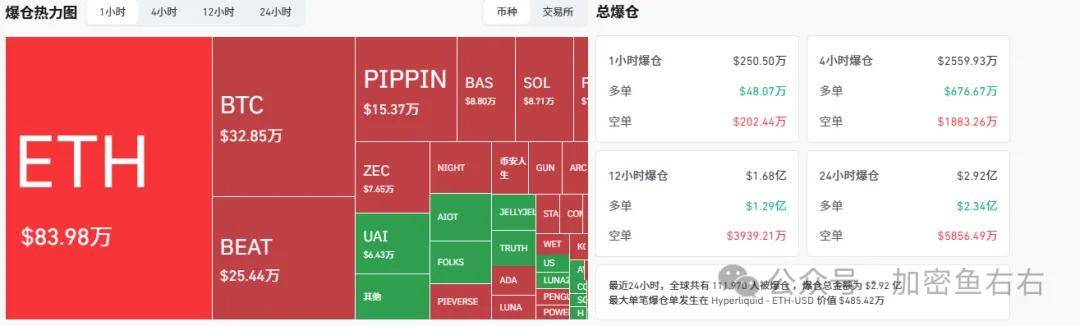
In the past 24 hours, a total of 111,938 people worldwide have had their accounts liquidated, with a total liquidation amount of $292 million! This week's sharp drop has shaken us out. Don't chase the highs. Hold steady in the morning session and watch the combined bullish and bearish signals from the European, American, and Asian markets before and after the North American market opens in the evening. Although both long and short positions are possible, the current price is essentially back to the level it was at when it was consolidating at the end of the weekend. If you want to go long, wait for a pullback to confirm the price level!
BTC
BTC closed with a bearish candlestick with upper and lower shadows in the morning, and the weekly chart closed with a bearish candlestick with a long upper shadow . It dipped to 8.75 and then quickly rebounded. Although the MACD 1H chart shows a golden cross, it is below the zero line, and the market outlook remains bearish.
On the daily chart, the price has been consolidating for 23 days since bottoming out on November 21st. The overall pattern resembles a wedge. However, a wedge is not a reversal pattern; it's more likely that after a rebound, the price will break below the lower edge of the wedge.
1) 80600 is a recent bottom, not a medium- to long-term bottom. After a rebound, it will break below this level, potentially leading to a BTC to Bitcoin starting with 7.
2) The 4-hour chart continues to show a range-bound market, with resistance at 91400-93400 and support at 83700-86600. Consider shorting at 9.14, with a stop-loss at 9.25, and targets at 8.92 and 8.86.

ETH
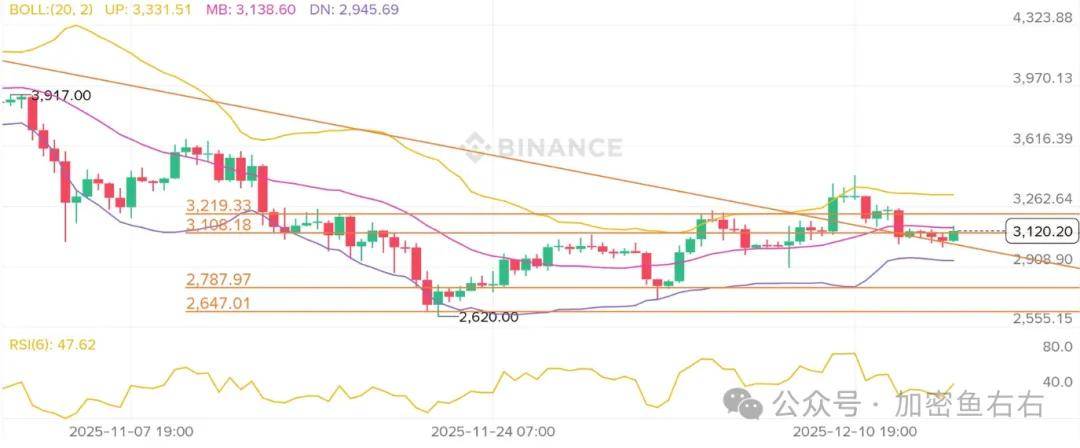
Ethereum's weekly chart closed with a long upper shadow bullish doji, while the daily chart maintains a bullish pattern of "higher lows and higher highs," and the upward trend line remains intact. After a short-term false break, the price quickly recovered, forming a bullish divergence, suggesting conditions for further rebound.
(1) The upper resistance levels to watch are 3150, 3250 and 3400: short positions can be entered around these levels. The lower support levels to watch are 3050, 2950 and 2800. Long-term short positions can be entered around 2600 and 2500.
(2) There is some support around ETH3050. If it breaks below, the 3k level will be lost. The rebound strength is getting weaker and weaker. Add short positions above 3100 or below 3044. Do not add short positions if the price does not reach 3100.
This week's key focus
Tuesday: Non-farm payroll data, influencing expectations for a rate cut in January next year;
Thursday: US CPI data, which will primarily influence Federal Reserve officials' decisions regarding interest rate cuts;
This week's key word: short.
Remove the "buy on dips" button. Don't go long until there's a significant price drop; don't buy the dips. The market will likely see minor price drops before Thursday, with the major drop expected no later than Christmas.
ORDI
The daily chart shows initial signs of bottoming out, and the market has entered a complex bottoming phase of "trading time for space." The price is oscillating within an extremely narrow range of 3.855-4.557, which is a typical "symmetrical triangle" convergence pattern, indicating that a major market reversal is imminent!

ZK
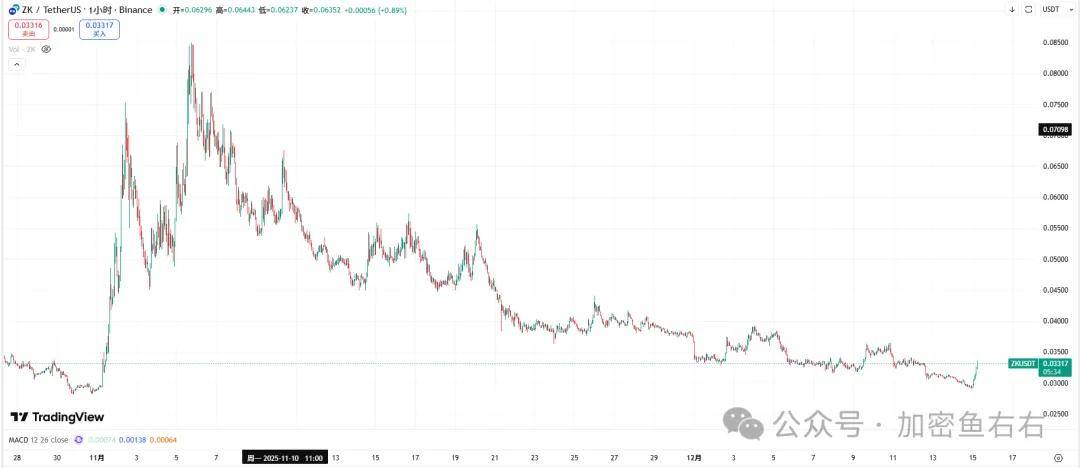
ZK has hit roughly the low point of the previous round's start, so I feel buying some spot wouldn't be a problem. I've set a stop-loss at 0.029. A downside stop-loss would be 10 points, and there's good potential upside!
ALPHA Cryptocurrency Update Today: While there are many ALPHA coins, very few are actually controlled by major players.
SENTIS: 0.03 all the way to 0.3, no contracts, one-sided market manipulation, just observe.
FOLKS: The screen was full of strong stocks a couple of days ago. After a wave of price drops from 47 to 20, it's easy for them to make a comeback after a shakeout. The strong will remain strong. If 23 is not broken, the outlook is bullish.
NIGHT: Current price 0.0656. Take a look. There's not much room for maneuver in new coins. Learn from experience.
BEAT: The contract rose from 0.2 to 2.8 with high trading volume, showing characteristics of speculative coins like COAI/MYX/AIA. The upward trend is volatile, making it suitable for buying on dips and selling when the trend ends.
JELLYJELLY: Also a strong player in the S-chain. Yesterday at 0.08, there was a good entry logic. Today at 0.11, the operation is very skillful and the trend is also relatively strong. In the upward trend, the possibility of $PIPPIN cannot be ruled out. If you want to trade, you need to keep a close eye on it.
ICNT: High-volume trading, current price 0.42, breakout from consolidation, giving the impression of significant upside potential, suitable for buying on dips. $POWER: Limited candlestick chart, requires further observation, current price 0.22, potential for both strength and weakness.
UAI has typically risen 0.2 to the current price, and the overall candlestick pattern is quite interesting.
IRYS: Observe the trading.
TAKE: The daily chart shows considerable strength, currently at 0.35. This kind of trading strategy is generally not suitable for most people.
The market is constantly changing, and specific entry and exit points should be determined based on real-time conditions. Follow the trend after a breakout! No matter how high your confidence level, please strictly adhere to your stop-loss and take-profit strategies! That's all for today! Follow me so you don't get lost! ( Add me on QQ: 3958133807 with a note, and I'll add you to my learning and discussion group.)