

BTC falls to $86,650 after resistance at $90,279.
ETH fails to recover above $3,000, trading at $2,830.
CryptoQuant: "BTC-ETH Supply Imbalance and New Capital Inflows Draining"
On-chain analytics platform CryptoQuant analyzed yesterday that the supply imbalance between Bitcoin and Ethereum is deepening, and market liquidity is very stagnant as new capital inflow into the virtual asset market dries up.
Amid stagnant liquidity, volatility across virtual assets, including Bitcoin, continues to rise. Bitcoin fell from $87,600 to $86,400 the previous day, then rebounded to $92,790. However, it encountered resistance precisely at the key resistance level previously identified by this publication, at $92,790, and fell to $87,375 today.
The situation for Ethereum (ETH) is not much different. It fell from $2,960 to $2,910 the previous day, then rebounded to $3,029, briefly recovering the $3,000 mark, but then fell again.
);)
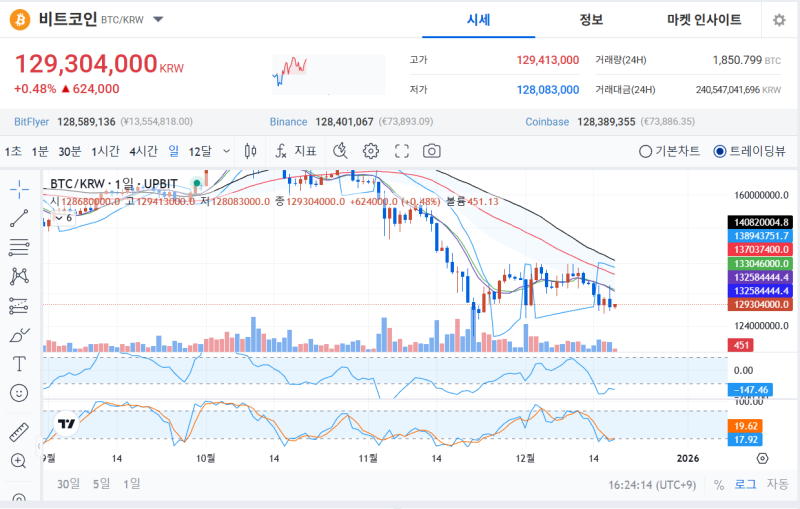
◇Bitcoin = As of 4:00 PM on the 18th, the Bitcoin price was 129.3 million won (approximately $129.3 million USD) on Upbit. Bitcoin's market share (dominance) stood at 60%.
Bitcoin is currently trading at $86,650, while Ethereum is trading around $2,830.
According to the on-chain analytics platform Sigbit, the long (rising) and short (falling) positions in the Bitcoin futures market stood at 71.45% and 28.55%, respectively. With the long position ratio exceeding 70%, market participants' expectations for an upward price increase remain dominant.
However, the depletion of new capital inflows and the deepening supply imbalance between Bitcoin and Ethereum, as pointed out by CryptoQuant, could potentially increase short-term volatility. In particular, the failure to break through key resistance levels during periods of stagnant liquidity suggests the possibility of further corrections.
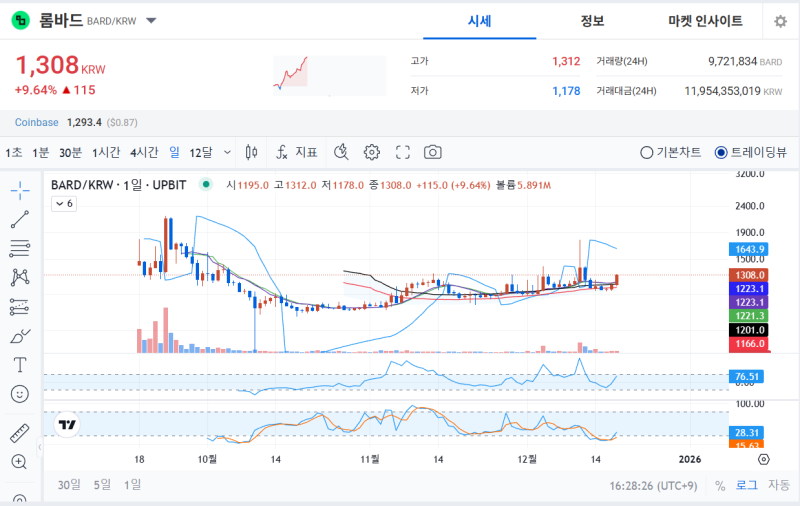
◇Rising Coin = As of 4 PM on the 18th, based on Upbit data, the virtual asset that showed a larger increase than the previous trading day was Lombard (BARD), showing a rise of approximately 9.6%.
);)
◇Fear-Greed Index = The Cryptocurrency Fear-Greed Index provided by Alternative recorded a score of 17, indicating "very fearful." This level represents a downward trend accompanied by high trading volume and strong volatility. It can be considered a buying zone for institutions, as it increases the likelihood of market entry at the bottom.
The cryptocurrency Relative Strength Index (RSI), provided by Sigbit, recorded a "neutral" reading of 42.1. The RSI measures the relative strength of upward and downward price pressure, determining whether a price is overbought or oversold.
Although the Fear and Greed Index has entered the "very fear" level, indicating a severe decline in market sentiment, the RSI remains neutral, suggesting further downside potential. However, given that the "very fear" level has historically been viewed as a medium- to long-term buying opportunity, this suggests a time to consider a bottom-buying strategy.
Joohoon Choi joohoon@blockstreet.co.kr


