Hedera is entering a risk zone. Over the past month, buying pressure has decreased by nearly 90%, while the HBAR price continues to fall. While many large crypto projects are trying to maintain stability, Hedera is not showing a similar positive reaction, especially when looking at the price chart.
Retail investors are gradually withdrawing instead of taking advantage of price drops. At this point, a sharp price fall is no longer an unlikely scenario but is becoming the most widely predicted outcome.
Spot buying has virtually disappeared as the downtrend continues.
Data from the HBAR spot market shows the clearest warning signs.
In the week ending November 10, 2023, Hedera recorded spot inflows of approximately $26.7 million, indicating strong buying pressure as coins were withdrawn from the exchange. However, by the final week ending December 15, 2023, this figure had dropped to only $2.4 million. Thus, buying pressure decreased by nearly 90% in just over a month.
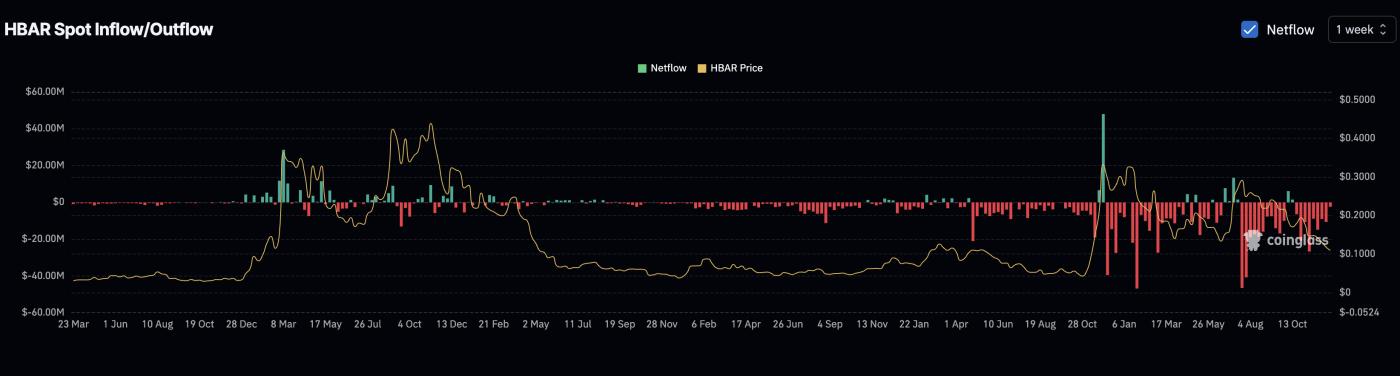 Investors are leaving the market: Coinglass
This is crucial because the HBAR price is moving within a descending price channel – a rather negative pattern. When retail investors stop buying when prices are low, it becomes even easier for sellers to push prices even lower. The market becomes fragile and vulnerable.
The Money Flow Index (MFI) also clearly confirms this weakness. The MFI tracks the flow of money into or out of an asset, based on price and volume. For HBAR , the MFI has consistently created new Dip along with the price and has now fallen into oversold territory. Instead of recovering, the MFI continues to decline.
Want to stay updated on Token? Sign up for editor Harsh Notariya's daily Crypto Newsletter here .
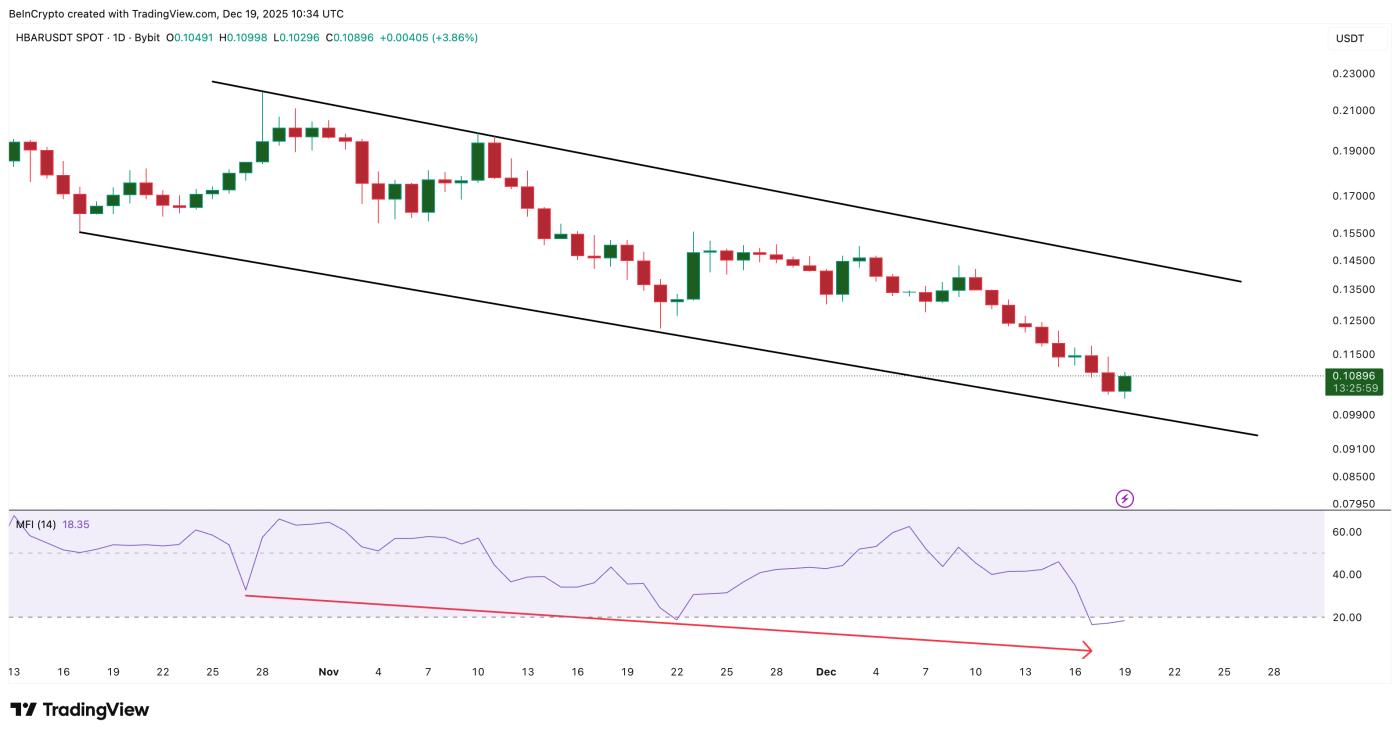 No buying pressure when prices fall: TradingView
This suggests that no one is keen to buy when prices are falling, leading to negative sentiment towards HBAR in the short term.
Why is the scenario of HBAR price decline gaining increasing attention?
With weak buying pressure and declining cash flow, the HBAR price is becoming the ultimate indicator for assessing trends.
HBAR is currently hovering near the lower boundary of its descending price channel. The first key level to watch is $0.106. If the closing price falls below this level, the next support level will be around $0.095, representing a further decline of approximately 12% from the current price. If this scenario occurs, HBAR could continue heading towards the $0.078 region.
If prices fall to that area, the negative trend will be further confirmed, rather than just a short-term dip.
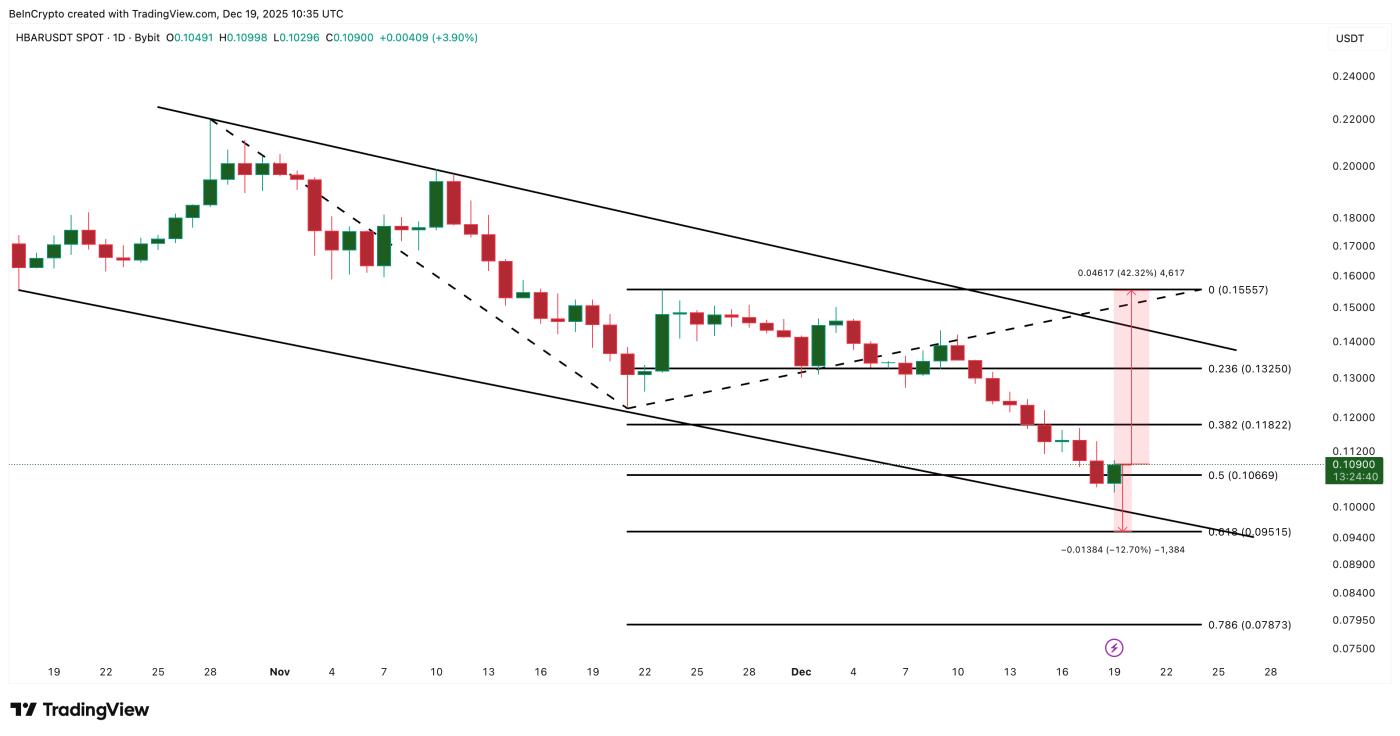 HBAR Price Analysis: TradingView
To break this downtrend, HBAR needs a strong breakout. The price needs to surpass several resistance zones and close near $0.155. However, with the sharp decline in spot buying pressure and the persistently weak MFI, this is almost impossible at the moment.
The conclusion is clear: the market is currently lacking buying power, money is flowing out, and prices are stuck in a downtrend. A further sharp drop in HBAR is no longer just a risk, but has become the dominant and most likely scenario at this point.