
Understanding the Practical Disk I/O Cost of KV Lookups in Blockchain Systems
An Empirical Study of Pebble under Realistic Blockchain State Workloads
Abstract
Many blockchain analyses and performance models assume that key-value (KV) storage reads incur O(log N) disk I/O complexity (e.g., TrieDB, QMDB), especially when using LSM-tree engines such as Pebble or RocksDB. This assumption is rooted in the worst-case scenario of SST traversal, where a lookup have to access multiple levels and, at each level, examine Bloom filters, index blocks, and data blocks.
However, we find that this model does not reflect real-world behavior. In practice, caches often hold most filter and index blocks, which can significantly reduce I/Os.
To understand the practical disk I/O behavior of LSM-based databases under realistic caching conditions, we conduct extensive controlled experiments using Pebble as a representative engine, spanning datasets from 22 GB to 2.2 TB (200M to 20B keys), and find that:
- Once Bloom filters (excluding LLast) and Top-Index fit in cache, most negative lookups incur zero disk I/O, and the I/Os per Get operation rapidly drops to ~2
(1 index block read and 1 data block read). - When all index blocks also fit in cache, the I/Os per Get operation further converges to ~1.0–1.3, largely independent of total database size.
- Data block caching has only a marginal effect on overall I/O under pure random-read workloads.
Overall, when the cache is sufficient to hold Bloom filters (excluding LLast) and the Top-Index
— roughly ~0.1%–0.2% of the total database size under blockchain-like workloads, Pebble exhibits effectively O(1) disk I/O behavior for random reads, challenging the common
assumption that each KV lookup inherently costs O(log N) physical I/O. This has direct implications for the performance modeling and design of blockchain trie databases and execution-layer storage systems.
Motivation
Blockchain execution layers typically depend on LSM-tree KV stores to serve billions of randomly accessed keys. A common assumption is:
“Each KV lookup in an LSM-tree costs
O(log N)disk I/O.”
However, in real blockchain systems, these assumptions often do not hold. Modern LSM-based KV engines such as Pebble rely heavily on:
- Bloom filters that eliminate most negative lookups;
- Small, highly reusable index structures;
- Block cache and OS page cache that keep frequently accessed metadata in memory.
As a result, the real physical I/O behavior of a KV lookup is often bounded by a small constant (≈1–2 I/Os), and becomes largely independent of total database size once Bloom filters and index blocks fit in cache.
These observations raise an important practical question:
At realistic blockchain scenarios, what is the practical disk I/O cost of a random KV lookup?
This study aims to answer this question with direct, empirical measurements, in order to:
- Validate or challenge the common
O(log N)KV lookup assumption, - Quantify how much cache is actually required to achieve near-constant read I/O,
- Providing empirical cache sizing recommendations for blockchain execution-layer persistent KV storage backends, including state tries and snapshot KV stores.
How We Validated the Hypothesis
This section describes how we validate our hypothesis that, under realistic caching conditions, Pebble’s practical read I/O cost is primarily governed by the cache residency of metadata rather than by LSM-tree depth as suggested by worst-case O(log N) models. We first examine Pebble’s read path to identify the concrete sources of I/O, then introduce two cache-driven inflection points that characterize I/O cost changes in read behavior. Finally, we outline the experimental setup used to observe these phases empirically and quantify their impact on I/Os per Get.
Understanding Pebble
Pebble Read Path and I/O Sources
A Get operation in Pebble proceeds as follows:
1. Lookup MemTable / Immutable MemTables and return value if found (in memory)2. Lookup MANIFEST to find candidate SST files (in memory)3. For each SST:a) Load Top-level index at reader initialization (used to locate internal index blocks after filter check)b) Table-level Bloom filter check (except LLast) → skip SST if key absentc) Internal index block lookup → locate data blockd) Data block lookup → read value and returnThe read path above references several internal components that appear throughout this paper. We briefly introduce them here for clarity.
Top-level index (Top-Index for short)
A tiny per-SST top-level index pointing to internal index blocks.
It is touched on almost every lookup and typically remains fully cached.
Internal index blocks (Index blocks for short)
Index blocks within each SST that map key ranges to data blocks.
They are accessed after a successful filter check and may incur one disk I/O if not cached.
LLast
The deepest level of the LSM tree. It stores most of the data and does not use Bloom filters during lookups.
Thus lookups that reach LLast follow the full path: Top-level index → index block → data block.
Why filters exclude LLast
Bloom filters for LLast would be prohibitively large, expensive to keep hot in cache, and provide limited benefit in practice because most positive lookups ultimately probe LLast regardless. Pebble therefore does not consult Bloom filters for LLast.
Two Practical Cache Inflection Points
From the read path described above, it is clear that a Get operation repeatedly consults a small and well-defined set of metadata components. Whether these components are resident in cache directly determines which parts of the read path incur physical I/O. Based on this observation and the aggregate cache footprint of each metadata class, we define two cache size thresholds —referred to as cache inflection points—which serve as the basis for analyzing read I/O behavior in the following sections.
Inflection Point 1 — Filter + Top-Index
Cache can hold:
- All Bloom filters (non-LLast)
- All Top-Index blocks
→ Negative lookups are almost always resolved in memory.
Inflection Point 2 — Filter + All-Index
Cache can hold:
- All Bloom filters (non-LLast)
- All index blocks across all levels
→ Positive lookups avoid index misses and approach minimum I/O.
Component Definitions
- Filter: Bloom filters for all non-LLast levels
- Top-Index: All top-level per-SST index blocks
- All-Index: Top-Index + all internal index blocks
Three Cache-Driven Phases of Read I/O Behavior
Based on the two cache inflection points defined above, we partition the cache size into three phases and describe the expected read I/O behavior in each.
Phase 1 —
Cache Size < Inflection Point 1
Filter and Top-Index misses are frequent → many unnecessary SST checks → higher expected read I/O cost.Phase 2 —
Inflection Point 1 < Cache Size < Inflection Point 2
Filters and Top-Index are cached → negative lookups are largely resolved in memory → read I/O is expected to decrease as index blocks begin to reside in cache.Phase 3 —
Cache Size > Inflection Point 2
Filters and all index blocks are cached → remaining I/O is expected to come primarily from data blocks → diminishing returns beyond this point.
Experimental Setup
This section describes the experimental methodology used to evaluate Pebble’s practical random-read I/O behavior under blockchain-like workloads. It summarize the experimental environment, datasets, workloads, and metrics used to measure cache residency and I/Os per Get, focusing on steady-state random-read behavior.
Hardware and Software
- CPU: 32 cores
- Memory: 128 GB
- Disk: 7 TB NVMe RAID0
- OS: Ubuntu
- Storage Engine: Pebble v1.1.5
Note: All experiments were conducted on Pebble v1.1.5. Read-path behavior, filter layout, or caching behavior may differ in Pebble v2+ and should be evaluated separately.
All benchmark code, Pebble instrumentation, and raw experiment logs are publicly
available at bench_kvdb for reproducibility.
Dataset
| Dataset | Small | Medium | Large |
|---|---|---|---|
| Keys | 200M Keys | 2B Keys | 20B Keys |
| DB Size | 22 GB | 224 GB | 2.2 TB |
| File Count | 1418 | 7105 | 34647 |
| Filter + Top-Index | 32 MB (0.14%) | 284 MB (0.12%) | 2.52 GB (0.11%) |
| Filter (including LLast) | 238 MB | 2.3 GB | 23 GB |
| All-Index | 176 MB | 1.7 GB | 18 GB |
| Filter + All-Index | 207 MB (0.91%) | 2.0 GB (0.89%) | 20.5 GB (0.91%) |
Key: 32-byte hashes
Value: 110 bytes (approximately the average RLP size of geth trie nodes)
Workload
- Pure random reads
- 10M Get operations per test
- Warm-up: 0.05% of keyspace
- No range scans
- No concurrent heavy writes or compactions
Note.
All experiments focus on steady-state pure random-read workloads on a single node, without concurrent heavy writes, compaction pressure, or range scans.
Metric
We rely on Pebble’s internal statistics to characterize read behavior, including:
- Bloom filter hit rate
- Top Index hit rate
- Index block hit rate
- Data block hit rate
- Overall block cache hit rate
- I/Os per Get — the final target metric
In Pebble, all block reads (filter, Top-Index, index, and data blocks) during a Get operation
are routed through the BlockCache. Every lookup first consults the cache, and a block-cache miss typically results in a single underlying physical read under minimal readahead and compaction interference.
where BlockCacheMiss is the total number of block-cache misses across all block types
(Bloom filters, Top-Index blocks, index blocks, and data blocks), and GetCount is the number of completed Get operations measured.
As a result, BlockCacheMiss closely tracks the practical physical read pressure and provides a stable, implementation-aligned measure of per-lookup I/O cost.
Results
We first analyze how cache size affects the hit rates of Bloom filters, Top-Index blocks, and index blocks. We then show how these effects translate into overall block cache hit rate and, ultimately, the I/Os per Get metric.
Throughout this section, Inflection Point 1 (IP1) refers to the cache size required to hold all non-LLast Bloom filters and Top-Index blocks (≈ 0.11%–0.14% of DB size in our bench datasets), while Inflection Point 2 (IP2) refers to the cache size required to hold all non-LLast Bloom filters and all index blocks (≈ ~0.9% of DB size in our bench datasets).
Bloom Filter & Top Index Hit Rate
| CacheSize | Small Dataset (Filter Hit Rate) | Medium Dataset (Filter Hit Rate) | Large Dataset (Filter Hit Rate) | Small Dataset (Top Index Hit Rate) | Medium Dataset (Top Index Hit Rate) | Large Dataset (Top Index Hit Rate) |
|---|---|---|---|---|---|---|
| At IP1 | 98.5% | 99.6% | 98.9% | 96.4% | 97.8% | 95.4% |
| Beyond IP1 (≈0.2% DB) | 100% | 100% | 100% | 100% | 100% | 100% |
Once the cache exceeds Inflection Point 1, both the Bloom filter and Top Index achieve close to 100% hit rate and negative lookups are resolved in memory.
Index Block Hit Rate
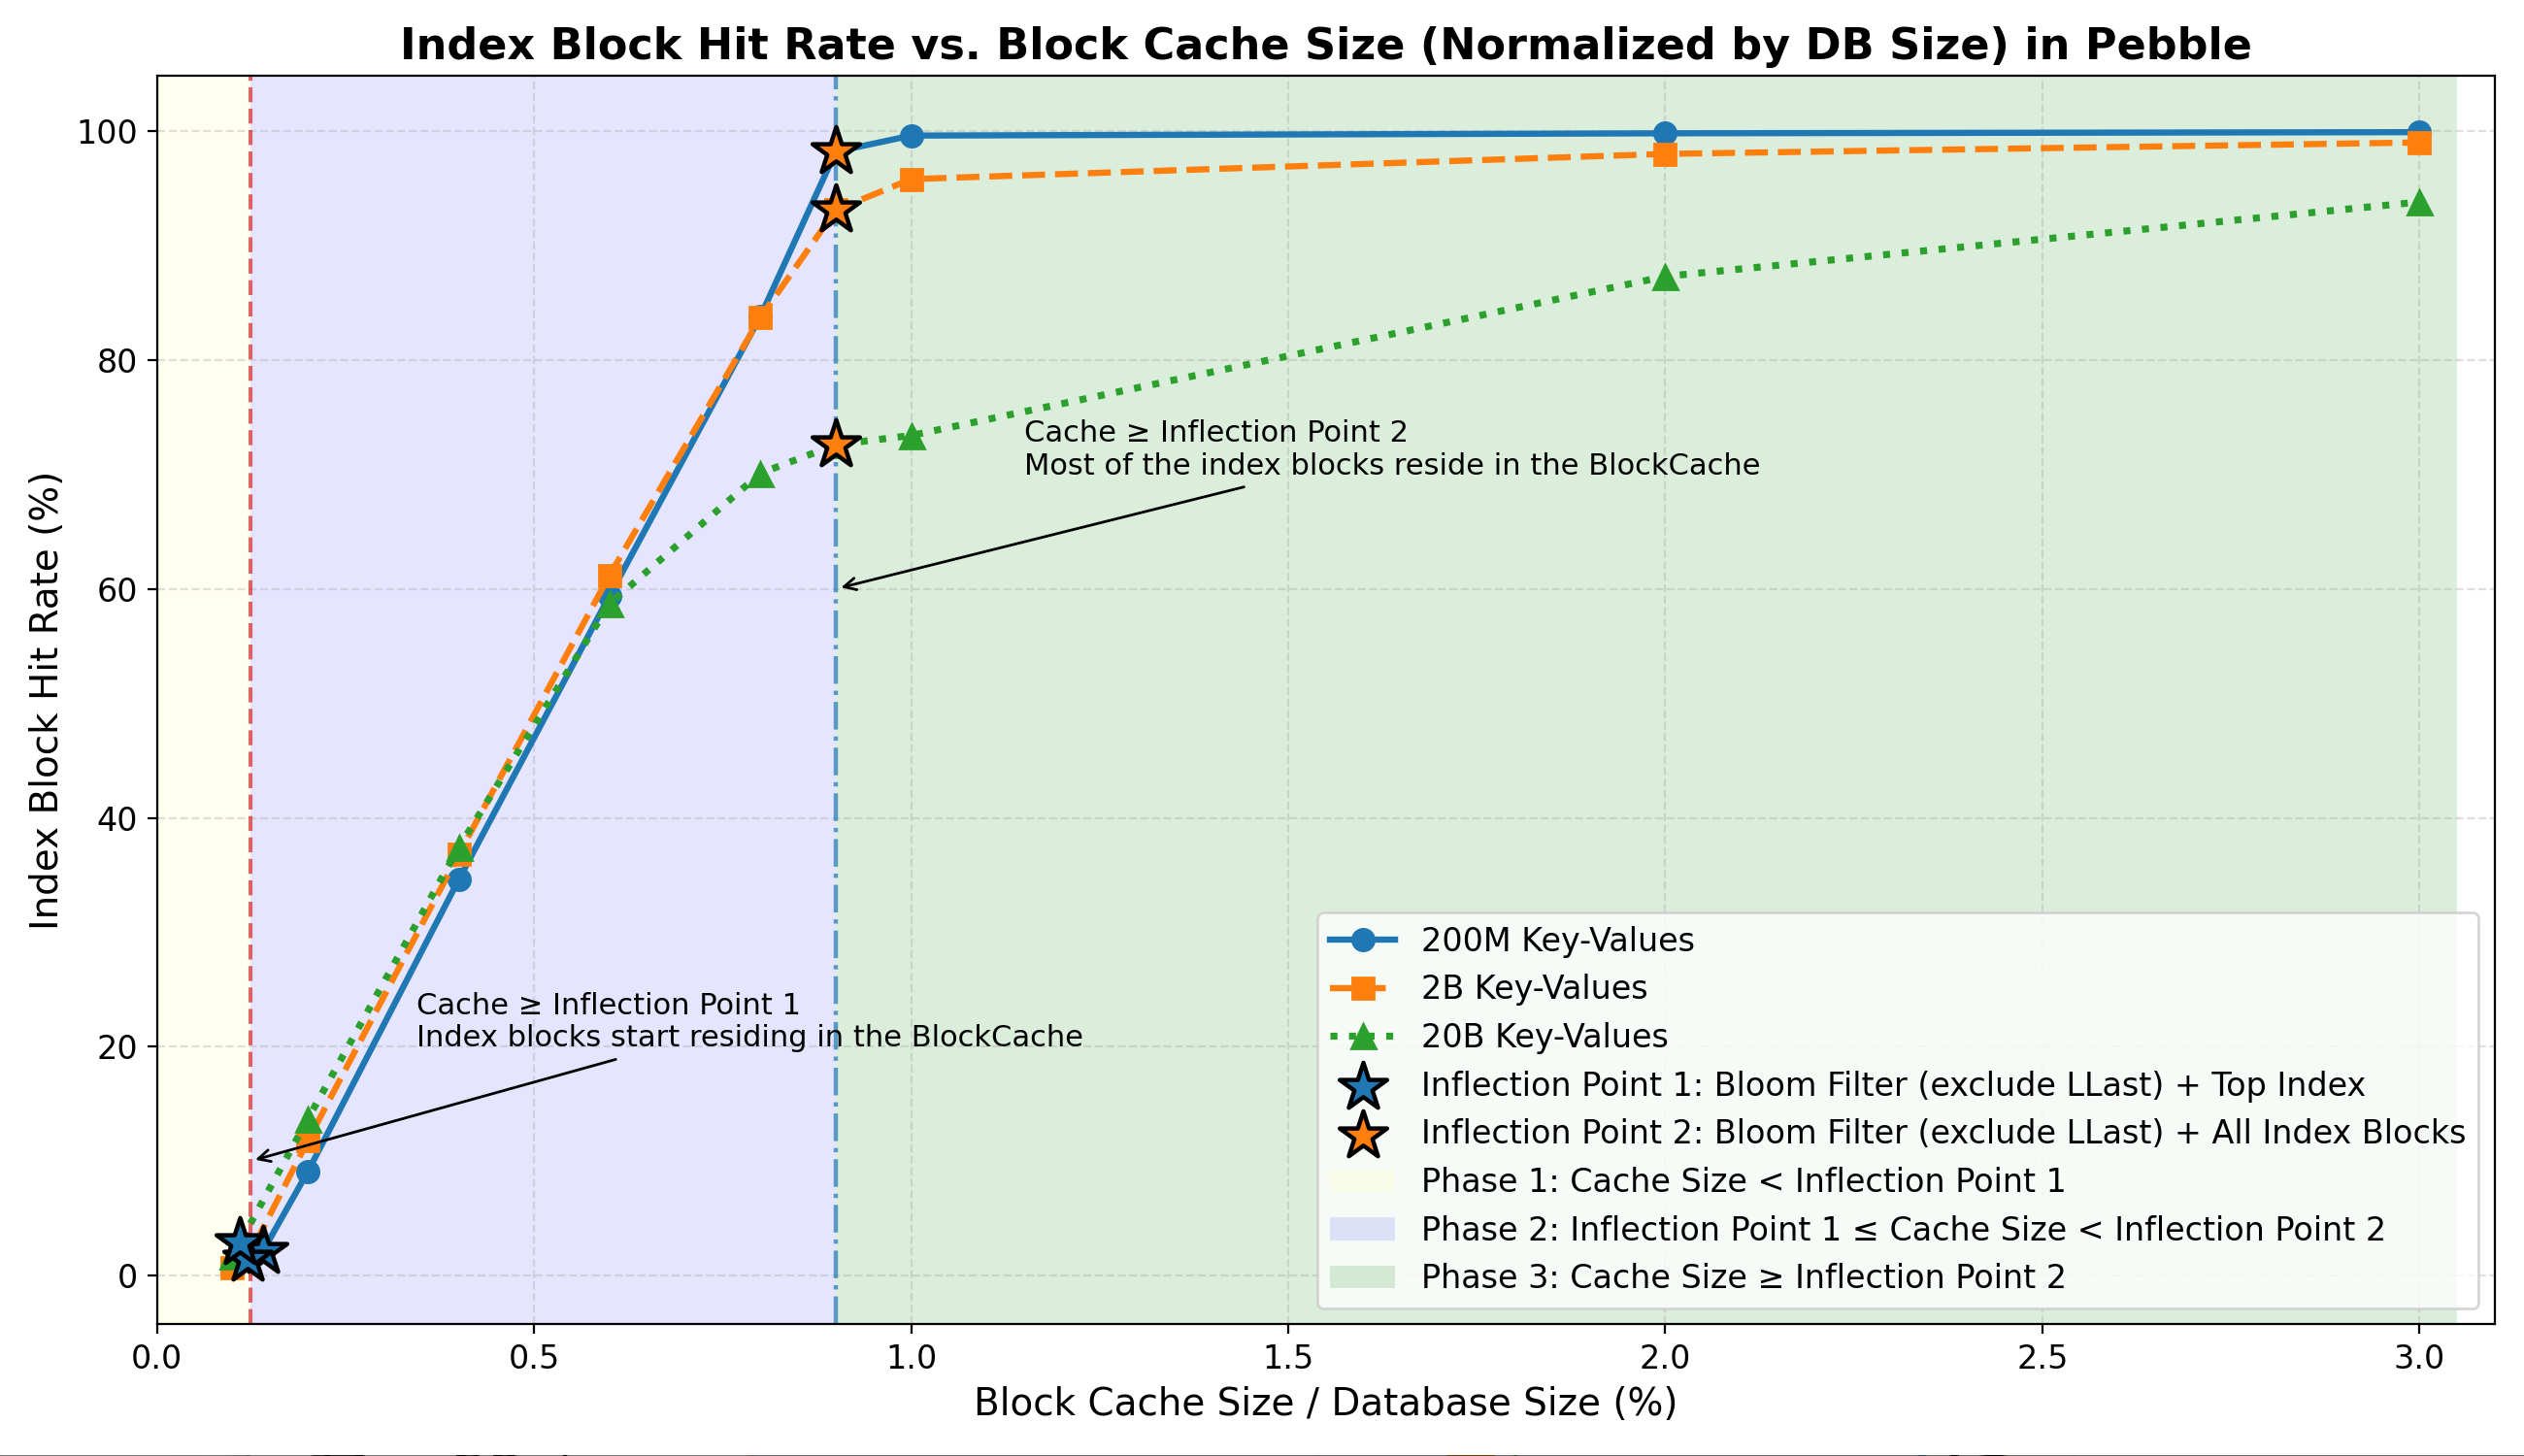
- Phase 1: Very few index blocks cached (may ~1%–3%).
- Phase 2: Index hit rises sharply to ~70–99% as the cache approaches Inflection Point 2.
- Phase 3: Most index blocks reside in memory, and the hit rate reaches a high plateau (~70%–99%) with only marginal further gains.
Data Block Hit Rate
| CacheSize | Small Dataset (Data Block Hit Rate) | Medium Dataset (Data Block Hit Rate) | Large Dataset (Data Block Hit Rate) |
|---|---|---|---|
| At IP1 | 1.0% | 0.7% | 1.3% |
| Beyond IP1 (≈0.2% DB) | 1.2% | 0.9% | 1.6% |
| At IP2 | 1.4% | 1.1% | 2.4% |
| Beyond IP2 (≈3% DB) | 3.2% | 3.0% | 4.3% |
Across all three phases, data block hit rate remains consistently low, data block caching contributes little to the observed I/O reduction in random-read workloads.
Overall Block Cache Hit Rate
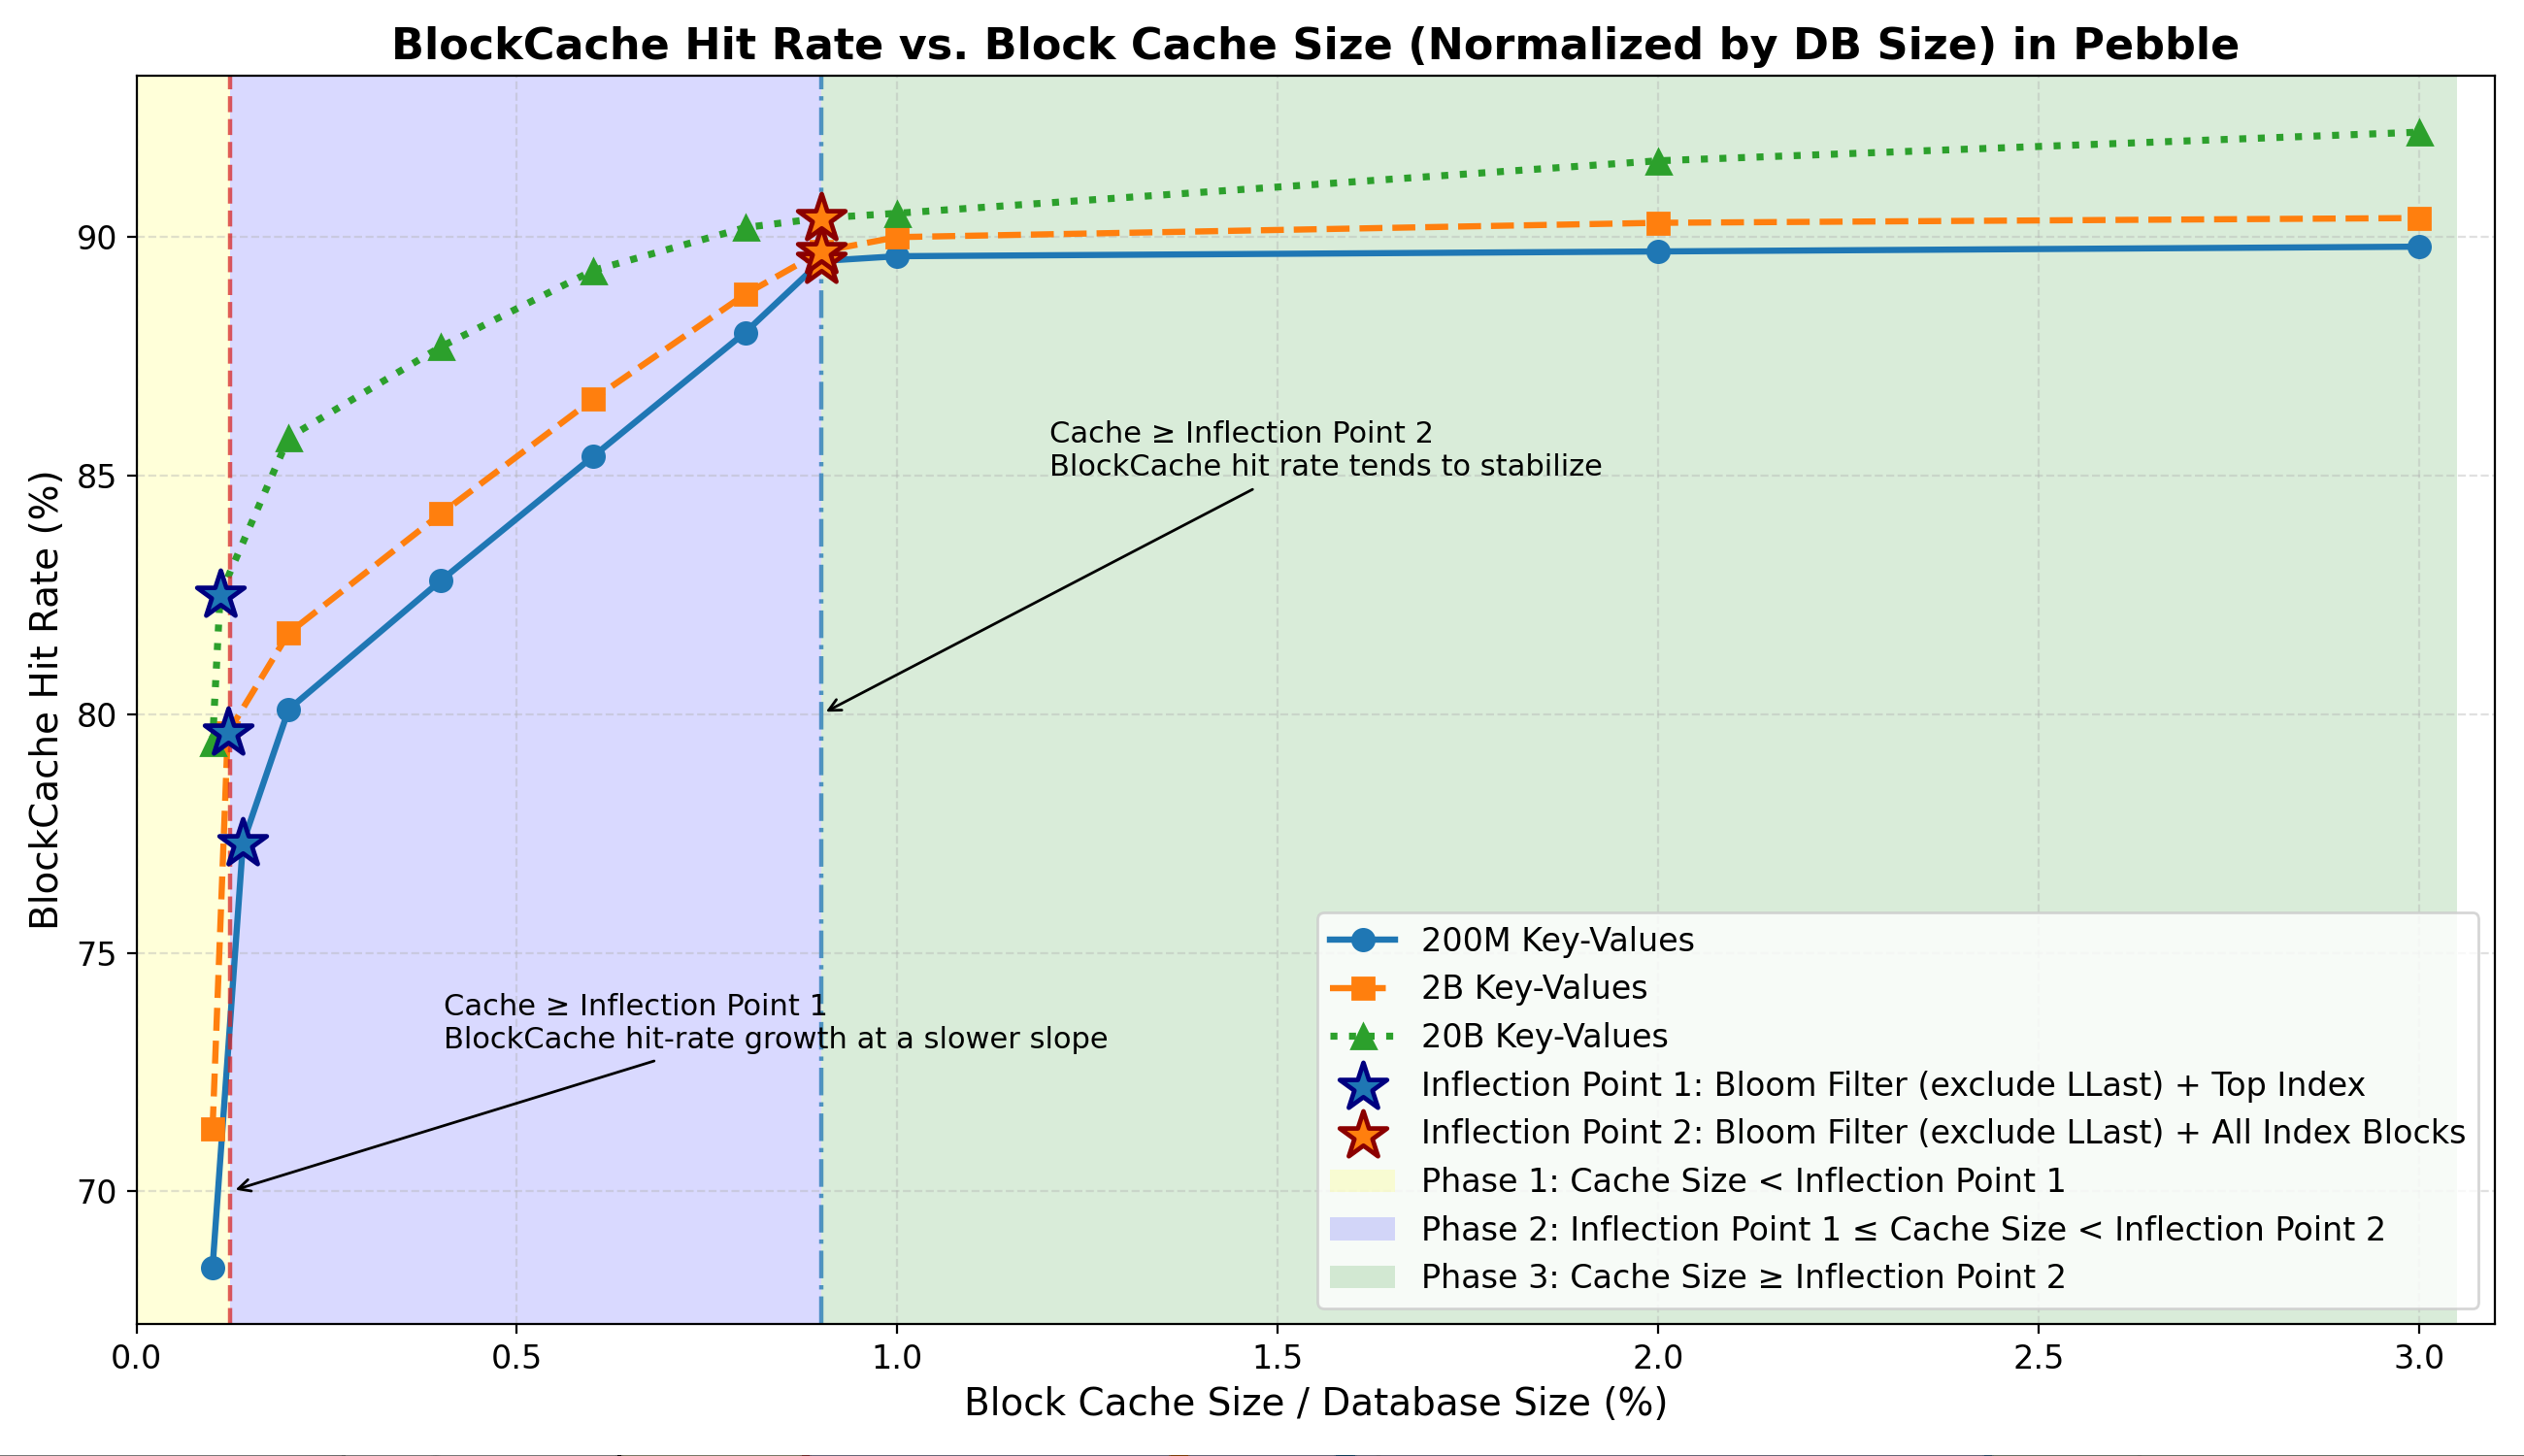
- Phase 1: Hit rate rises steeply, driven by the rapid in-memory residency of Bloom filters and Top Index.
- Phase 2: Hit rate grow at a slower slope driven by index blocks become resident.
- Phase 3: Hit rate stabilizes, since data block caching contributes little under random read workloads.
Read I/O Cost per Get (Key Result)
This section summarizes how the cache residency of different metadata components ultimately translates into end-to-end random-read I/O cost.
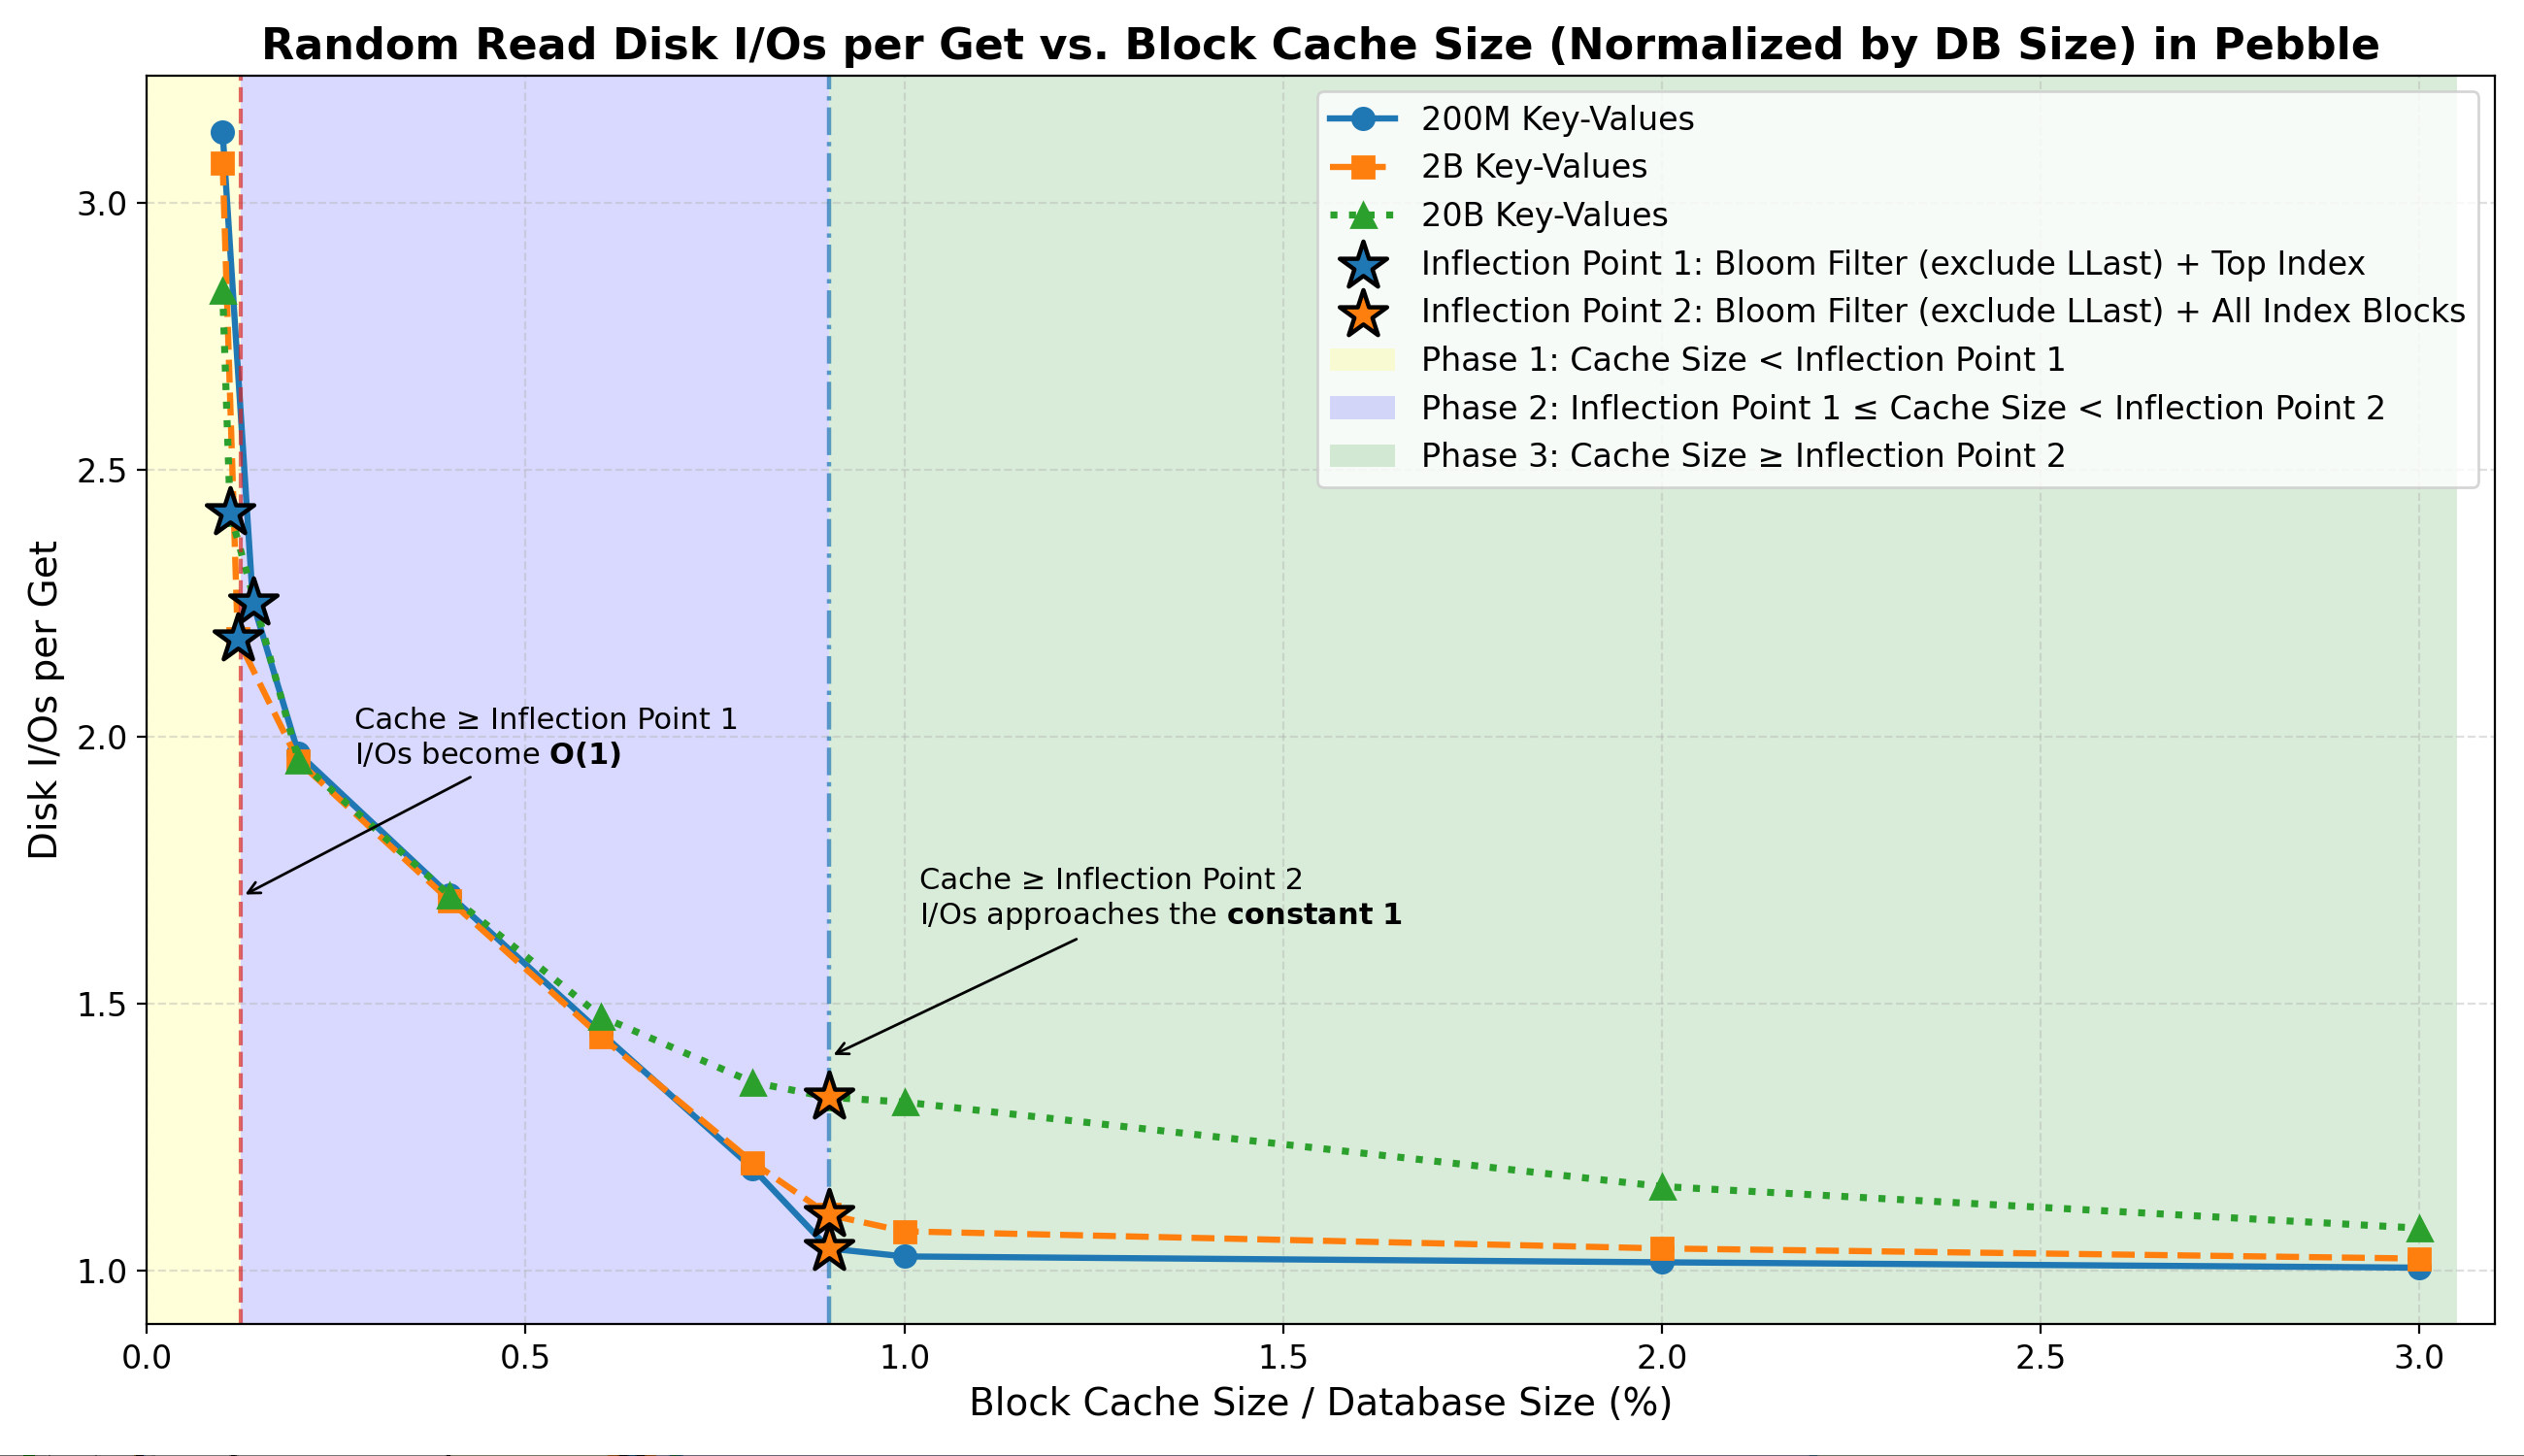
- Inflection Point 1 (
Filter + Top-Index)
Once the cache reaches this point:- Filter & Top Index hit rates reach ~100%.
- Most negative lookups are resolved entirely in memory.
- Random-read
I/Os per Getstabilize at ~2.2–2.4 (effectively O(1) lookups).
- Phase 2 (between the two Inflection Points)
In this transition region:- Index block residency grows rapidly and index block hit rate rises sharply to ~70%–99%.
- I/Os per Get drop sharply toward 1.0–1.3.
- Inflection Point 2 (
Filter + All-Index)
Beyond this point:- Random-read
I/Os per Getapproach the tight lower bound ~1. - Further cache growth yields only marginal additional I/O reduction.
- Random-read
- Data block caching remains negligible in all phases.
- Behavior consistent across dataset sizes (22 GB – 2.2 TB):
This confirms:
Overall, random-read I/O is primarily governed by Bloom filter and index residency.
Conclusion & Recommendations
Although the theoretical worst-case read complexity of Pebble is O(log N), this bound is rarely observable in practice under realistic cache configurations.
With sufficient cache residency of Bloom filters (excluding LLast) and index blocks, the practical read I/O behavior of Pebble is effectively O(1) and consistently converges to 1–2 I/Os per Get operation.
Cache Configuration Recommendations
Our results show that Pebble’s read I/O cost is governed primarily by which metadata components fit in cache, rather than by LSM-tree depth. In practice, cache sizing can therefore be chosen directly based on the desired read performance.
Near-constant read performance (~2 I/Os per Get)
Cache beyond Inflection Point 1 (Bloom filters excluding LLast + Top-Index blocks).
This requires only a tiny cache (typically < 0.2% of DB size) and removes most negative-lookup I/O.
Suitable for memory-constrained deployments requiring predictable read performance.Near–single-I/O reads (~1.0–1.3 I/Os per Get)
Cache beyond Inflection Point 2 (Bloom filters + all index blocks).
This requires a small cache (typically < 1.5% of DB size) and brings reads close to the practical lower bound.
Suitable for latency-critical execution layers and read-intensive workloads.
Beyond Inflection Point 2, further increasing cache size provides only marginal additional I/O reduction under random-read workloads.