

Monero is attempting a countertrend recovery, with XMR Daily Bias: Countertrend Bounce Inside a Bearish Structure as the broader crypto market remains in extreme fear and favoring majors over altcoins.
Summary
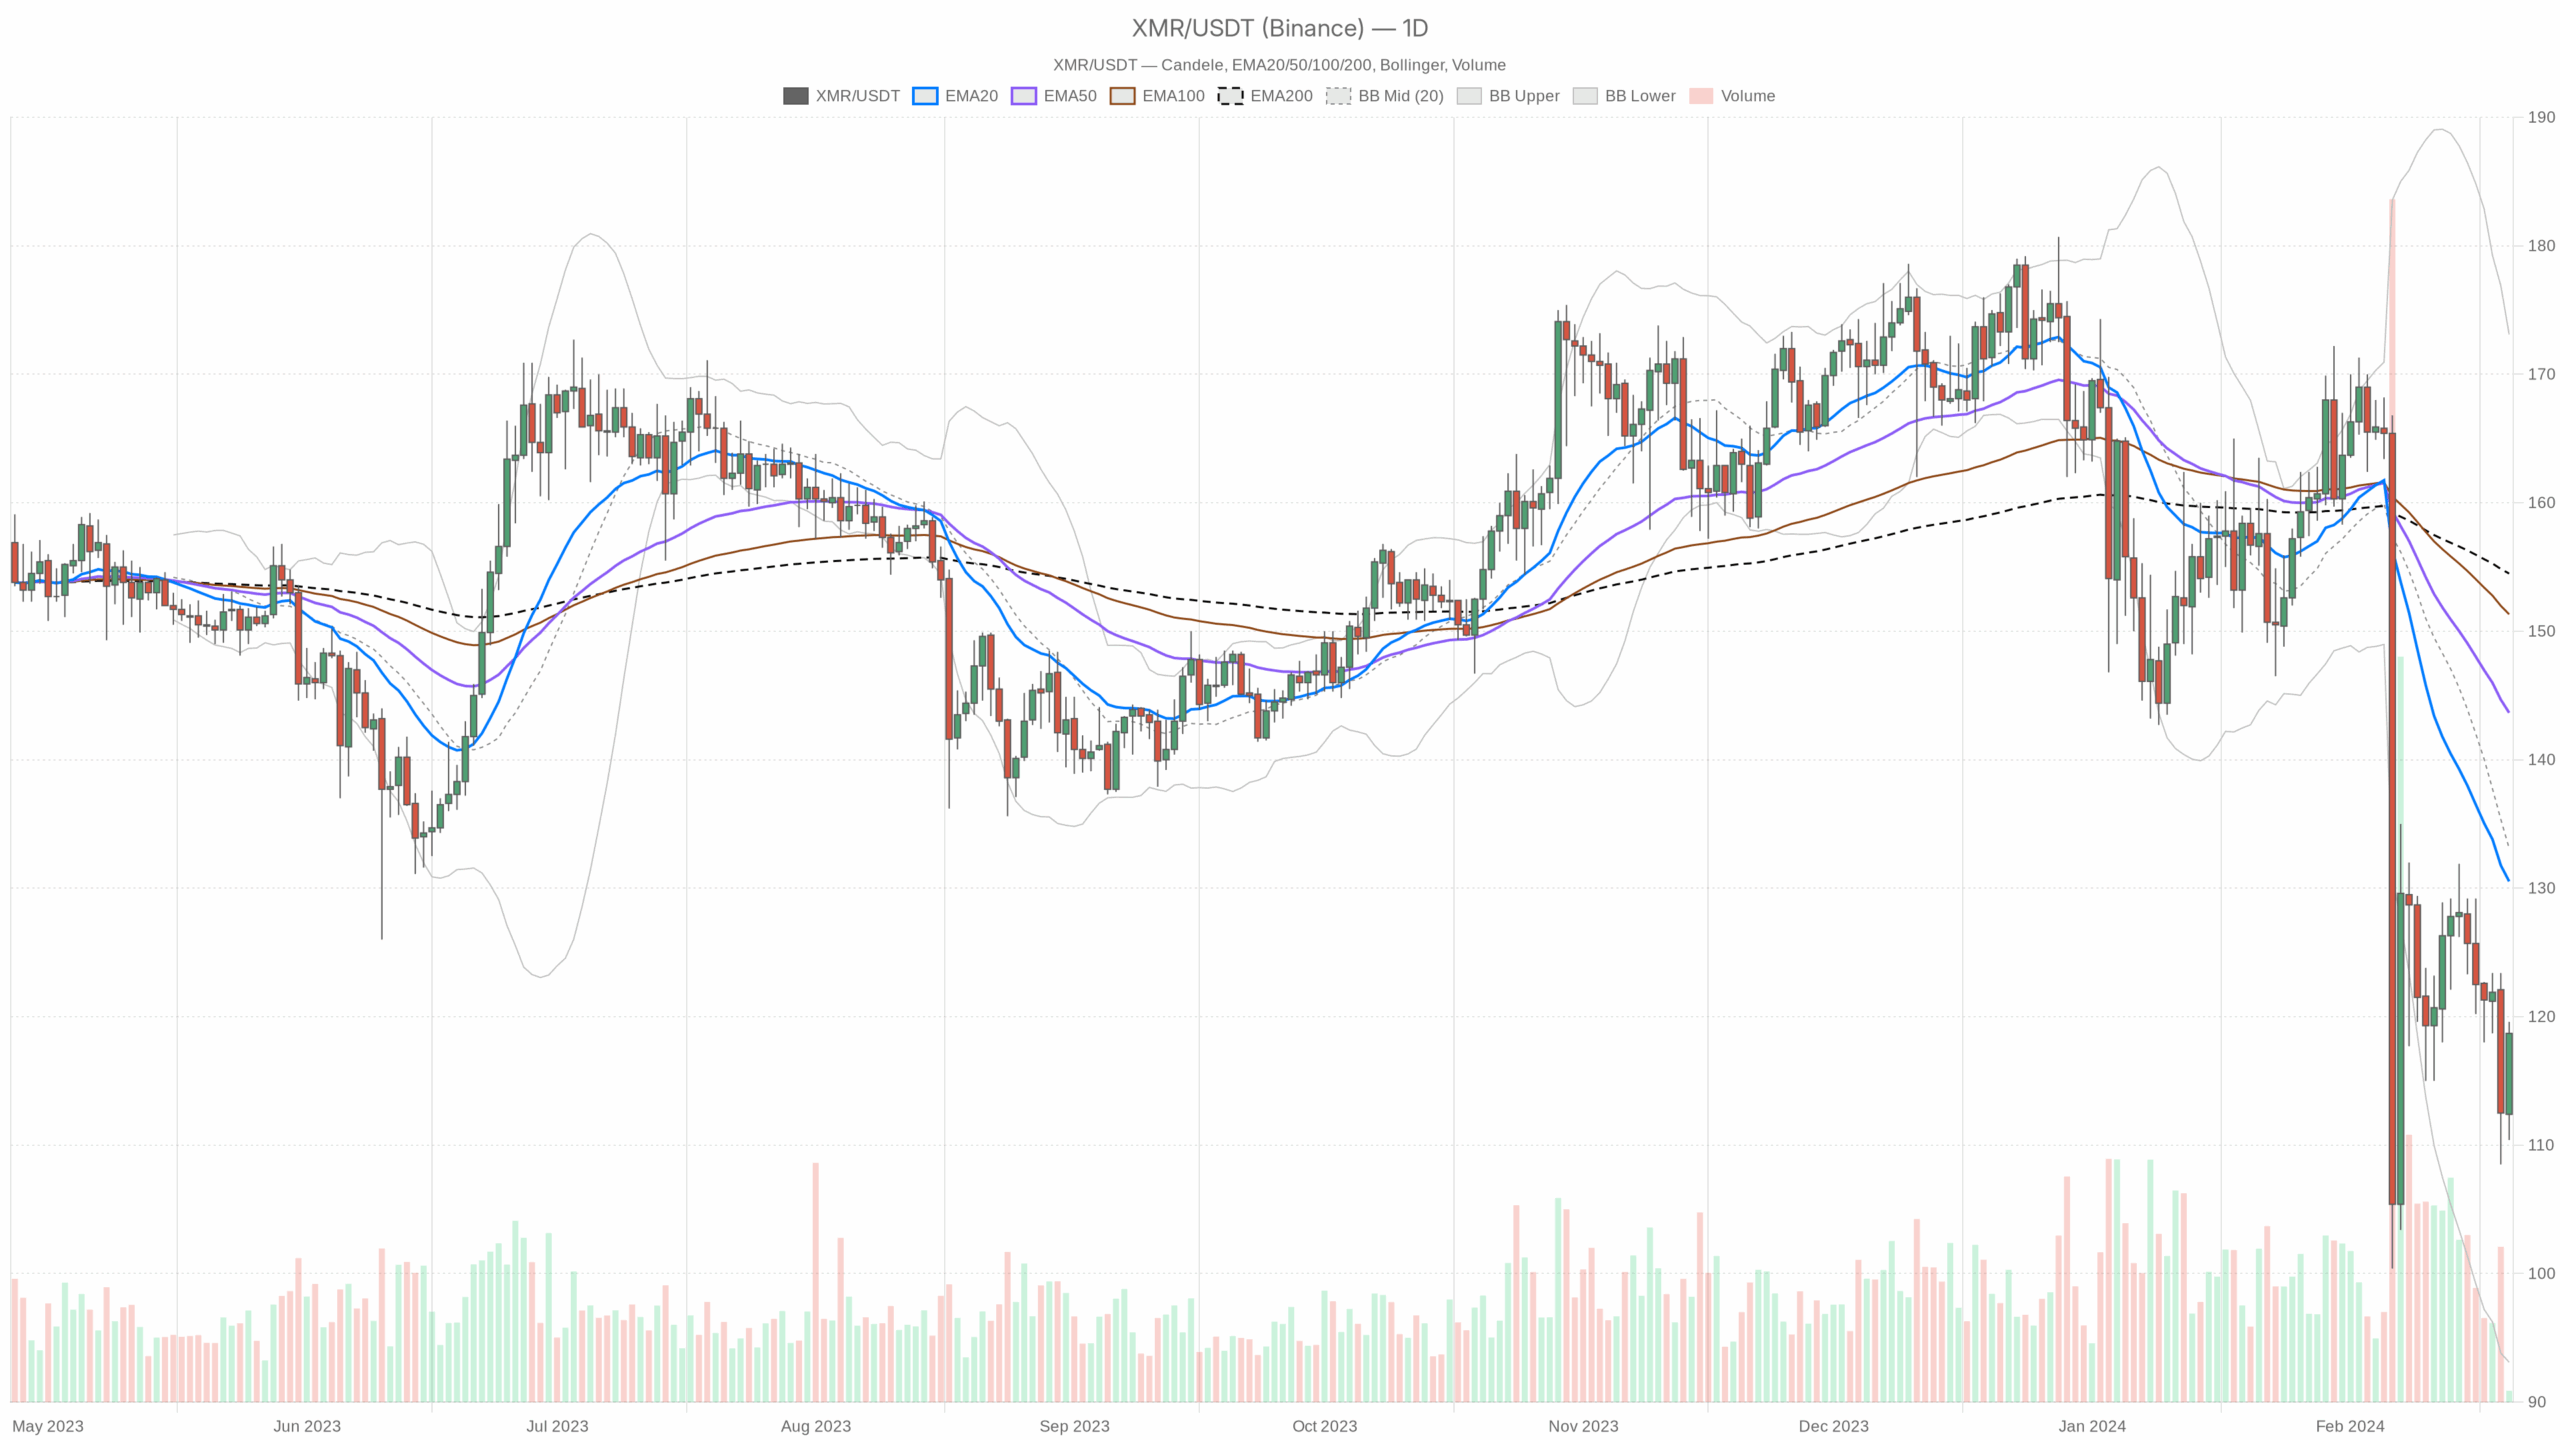
Daily structure (D1): Trend still down, bounce from support
On the daily, XMR closed near 118.7, modestly above the daily pivot point at 116.23. Price sits below the 20, 50, and 200 EMA clusters, and that alignment keeps the macro bias bearish.
EMA (D1)
– EMA20: 130.53
– EMA50: 143.65
– EMA200: 154.49
XMR is trading well below all three EMAs. The short-term trend (20 EMA) is below the medium and long-term (50 and 200), and price is even further underneath that entire stack. This is classic bear-market behavior: rallies are statistically more likely to be sold into until price can at least reclaim the 20-day EMA and hold above it.
RSI (D1)
– RSI14: 38.32
RSI is below 40, which lines up with a weak but not yet oversold market. Sellers are still in control overall, but the reading is not at capitulation levels. There is room both for a bit more downside and for a bounce, which fits the idea of a countertrend rally inside a downtrend rather than a blow-off bottom.
MACD (D1)
– MACD line: -9.66
– Signal: -8.97
– Histogram: -0.69
MACD remains in negative territory with the line under the signal and a slightly negative histogram. Bearish momentum is still present, but the histogram is relatively small, hinting that the down-leg may be losing intensity. That is consistent with a market pausing after a sell-off, not yet convincingly turning the corner.
Bollinger Bands (D1)
– Middle band: 133.1
– Upper band: 173.11
– Lower band: 93.1
Price around 118.7 is trading in the lower half of the bands, well below the midline at 133.1. That positioning still reflects a downside-skewed regime. The lower band at 93.1 marks the tail risk if the broader crypto selloff accelerates, while the middle band roughly coincides with the first serious mean-reversion target if buyers regain control.
ATR (D1)
– ATR14: 10.34
Daily volatility is meaningful but not extreme: a typical daily range of about $10 on a $118 asset. That is enough room for sharp intraday squeezes, but it does not look like a panic phase. It supports the notion of a grinding downtrend with occasional strong relief rallies rather than a vertical crash.
Daily Pivot Levels (D1)
– Pivot (PP): 116.23
– Resistance R1: 122.07
– Support S1: 112.87
Price is currently just above the daily pivot at 116.23, leaning towards the upper half of the intraday range. That tells us buyers have made some progress intraday, but they have not broken the first meaningful resistance at 122.07. A move below 116.23 would tilt the balance back toward sellers, while a push above 122.07 would open room for a stronger short-covering move toward the mid-Bollinger zone.
1H context: XMR countertrend bounce against the daily downtrend
The 1-hour chart is where we see the current fight more clearly. The hourly regime is marked as neutral, which makes sense: the trend is trying to shift, but has not fully flipped.
EMA (H1)
– EMA20: 115.86
– EMA50: 118.31
– EMA200: 122.02
On H1, price at 118.7 is above the 20 and 50 EMA but still below the 200 EMA. Short-term, buyers have seized control from the lows, yet the larger intraday trend marker (200 EMA) is still overhead as resistance. This is textbook countertrend action: momentum longs are in play on the lower timeframes, but they are still running into a higher-timeframe ceiling.
RSI (H1)
– RSI14: 56.78
Hourly RSI just above 50 shows moderate bullish momentum. Buyers are pressing the tape higher, but the reading is far from euphoric or overbought. That gives room for continuation higher in the near term, especially if price can reclaim the 1H 200 EMA around 122.
MACD (H1)
– MACD line: -1.71
– Signal: -2.00
– Histogram: 0.29
MACD is still below zero but the line has crossed above the signal with a positive histogram. Momentum has shifted from bearish to short-term bullish, yet the fact that both lines remain negative underlines this is a rally within a broader down phase, not a fully reset trend.
Bollinger Bands (H1)
– Middle band: 116.28
– Upper band: 124.46
– Lower band: 108.1
Price is sitting slightly above the mid-band, working its way toward the upper band at 124.46. That favors the bulls intraday: the path of least resistance in the very short run is up, but the upper band lines up close to the 1H 200 EMA region, meaning upside is likely to meet selling interest around 122–124 unless the daily picture improves.
ATR (H1)
– ATR14: 3.77
The hourly ATR around 3.8 signals a fairly active tape: 3–4 dollar swings intraday are normal here. That is enough noise to shake out weak hands around levels like the pivot or R1 without changing the bigger picture.
Pivot Levels (H1)
– Pivot (PP): 117.4
– Resistance R1: 120.9
– Support S1: 115.2
Price is hovering above the hourly pivot at 117.4, leaning slightly bullish intraday. The first upside cap comes near 120.9, which sits just below the 1H 200 EMA and inside the hourly upper band zone. If XMR can hold above 117.4 and punch through 120.9, the bounce can extend. Lose 117.4 decisively, and the intraday bounce starts to lose credibility.
15m execution view: Short-term overbought inside the bounce
The 15-minute chart confirms the bounce but shows it getting stretched.
EMA (M15)
– EMA20: 114.02
– EMA50: 114.5
– EMA200: 118.12
On the micro timeframe, price at 118.7 is well above the 20 and 50 EMA and has just pushed above the 200 EMA at 118.12. The short-term trend is firmly up, and this is where late buyers typically chase. It is constructive for bulls in the very near term but also a spot where countertrend rallies often start to cool off or chop.
RSI (M15)
– RSI14: 71.14
RSI above 70 on the 15m is overbought. That does not mean the move must reverse immediately, but it does mean the easy upside from this leg is likely behind us. From here, you would normally expect either a consolidation or a pullback before any sustainable next leg higher.
MACD (M15)
– MACD line: 0.71
– Signal: 0.11
– Histogram: 0.60
MACD is positive with the line well above the signal and a strong positive histogram. Short-term momentum is clearly bullish, which matches the overbought RSI: this is a powerful but potentially tired push. Often, that combination leads to sharp but brief spikes followed by mean reversion on this timeframe.
Bollinger Bands (M15)
– Middle band: 113.61
– Upper band: 116.71
– Lower band: 110.52
At 118.7, price is trading above the upper band on the 15m. That is a classic sign of a short-term overextension. Moves outside the band can continue a bit further in strong squeezes, but statistically they tend to revert back toward the mid-band (around 113–114) once the immediate buying pressure cools off.
ATR (M15)
– ATR14: 2.06
The 15m ATR near 2 tells you that moves of a couple of dollars in either direction within a short time window are completely normal here. Anyone trading very tight stops near local levels should expect to get whipped around.
Pivot Levels (M15)
– Pivot (PP): 117.77
– Resistance R1: 120.53
– Support S1: 115.93
Price is just above the 15m pivot at 117.77 and between that and the first resistance at 120.53. Bullish micro-structure for now, but with RSI and bands stretched, the risk of a pullback toward 117.77 or even 115.93 increases if buyers hesitate near 120–121.
How the timeframes fit together
The message across timeframes is mixed but coherent:
– Daily: clear bearish trend, price below all major EMAs, RSI sub-40, negative MACD, trading in the lower half of the Bollinger envelope.
– 1H: neutral-to-bullish bounce, price reclaiming short EMAs, positive MACD cross, RSI mid-50s, but still under the 200 EMA.
– 15m: strong short-term rally, overbought RSI, price outside upper Bollinger band.
In plain language, this is a bear market rally until proven otherwise.
Scenarios for XMR
Primary Bias: Bearish (daily trend)
The dominant force is still the daily downtrend, backed by macro risk-off conditions and extreme fear sentiment.
Bearish scenario
In the bearish path, the current bounce stalls into the 120–124 area, where the 1H R1 (120.9), 1H 200 EMA (122.02), and upper 1H Bollinger band region (~124) cluster. Overbought lower timeframes then unwind, pushing price back below the 1H pivot at 117.4 and the daily pivot at 116.23.
Once back under those pivots, selling pressure could drive XMR toward daily S1 at 112.87. If broader market weakness continues, the next structural reference is the lower daily Bollinger band near 93 as a tail-risk extension in a sustained downtrend.
This bearish scenario is invalidated if XMR can reclaim and hold above the daily EMA20 around 130.5 with daily closes, ideally accompanied by an RSI push back above 50 and MACD flattening near zero. That would signal that the downtrend is losing its grip and the market is transitioning into at least a broader range, if not a new uptrend.
Bullish scenario for XMR
For the bullish case, the current short-term strength needs to turn into something more than just short covering. First, bulls want to see the 1H structure firmly flip: hold above 117.4 on pullbacks, break and consolidate above 120.9, and then take out the 1H 200 EMA at 122.02. That would open up space for a push toward the daily mid-Bollinger and EMA20 zone around 130–133.
From there, the real test begins. A sustained series of daily closes above 130–133, combined with daily RSI climbing into the mid-50s and MACD curling up toward the zero line, would turn this from a simple relief rally into a credible trend change attempt. In that environment, the 50-day EMA near 143–144 becomes the next logical upside magnet over time.
This bullish scenario breaks down if price loses the local supports now being built: a clear move back below 117.4 (1H pivot) and then 116.23 (daily pivot), especially if accompanied by an hourly RSI drop back under 45 and a renewed negative MACD cross. That would indicate the bounce has been rejected and the bears are reasserting control.
Positioning, risk and uncertainty
Right now, the market is offering a classic tension: the daily chart says trend is down and rallies are to be sold, while the intraday charts say shorts are being squeezed and late entries are risky. Extreme fear and a rising BTC dominance backdrop amplify that: risk appetite for privacy coins like Monero tends to be low when the market is hiding in BTC and stables.
For directional traders, the key is to respect the timeframe you are trading. The daily bias is still bearish, so swing approaches naturally skew toward fading strength into resistance zones like 120–124 and, if reached, 130–133. On the other hand, intraday players will see opportunity in the current long side as long as 117–118 holds, but they are trading against the larger trend and need to be quicker on risk management.
Volatility is moderate to high across timeframes (ATR readings), so position sizing and stop placement matter more than usual. Current conditions can punish both overconfidence and hesitation: late shorts can get squeezed hard, and late longs can be trapped if the higher timeframe downtrend reasserts suddenly.
The bottom line: XMR is trying to heal, but it is doing so inside a still-intact bearish structure and a cautious macro crypto environment. Until the daily chart proves otherwise, any strength is guilty of being a rally in a downtrend first and a new bull leg only if it can clear and hold above the key daily moving averages.
This section contains a sponsored affiliate link. We may earn a commission at no additional cost to you.
Disclaimer: This analysis is for informational and educational purposes only and reflects a technical view of the market data provided. It is not investment, trading, or financial advice, and it does not take into account your individual circumstances or objectives. Markets are volatile and unpredictable; always conduct your own research and manage risk independently.


